Verification of tracks made of Cosme using GEFS mean fields
I made eight tracks of Tropical Storm Cosme. Additionally, within 384
hours of cyclogenesis, there were 15 instances, when I missed
cyclogenesis entirely. All the tracks were made relatively close to cyclogenesis. In those tracks, longevity and intensity were overestimated. As actual cyclogenesis got very close, the precursor disturbance of Cosme had two competing spins, and my technique produced tracks from the wrong one, resulting in relatively huge position errors at shortest lead times.
As of this analysis, best track positions are available July 3, 06Z thru July 8, 12Z, and as such, position comparisons are possible only for this timespan.
Getting out of the frame of East Pacific tracking map is considered equal to dissipation for the purpose of this verification.
Since I give only SSHS categories in my tracks, I don't calculate intensity errors in units of speed, but in categories. For this purpose, I define tropical or subtropical storms as "Category 0", tropical or subtropical depressions as "Category -1" and non-existence of a tropical or subtropical cyclone as "Category -2".
In the eight tracks, formation times ranged between July 5, 00Z and July 7, 12Z. Average was July 6, 00Z and median was July 5, 12Z.
In the 23 cases (8 tracks and 15 complete misses), peak intensity ranged between Category -2 and Category 5. Average was Category -0.35 and median was Category -2.
In the eight tracks, dissipation times ranged between July 11, 00Z and July 19, 12Z. Average was July 15, 04Z and median was July 14, 00Z.
At the lead time of 1 day (24 hours), there were 0 hits, 1 false detection and 0 misses. 1 available position comparison produces an average error of 526 nautical miles.
At the lead time of 2 days (48 hours), there were 1 hit, 2 false detections and 0 misses. 3 available position comparisons produce an average error of 295 nautical miles.
At the lead time of 3 days (72 hours), there were 2 hits, 1 false detection and 0 misses. 3 available position comparisons produce an average error of 305 nautical miles.
At the lead time of 4 days (96 hours), there were 2 hits, 2 false detections and 0 misses. 3 available position comparisons produce an average error of 319 nautical miles.
At the lead time of 5 days (120 hours), there were 2 hits, 3 false detections and 0 misses. 3 available position comparisons produce an average error of 347 nautical miles.
At the lead time of 6 days (144 hours), there were 3 hits, 3 false detections and 1 miss. 3 available position comparisons produce an average error of 394 nautical miles.
At the lead time of 7 days (168 hours), there were 2 hits, 4 false detections and 1 miss. 2 available position comparisons produce an average error of 442 nautical miles.
At the lead time of 8 days (192 hours), there were 0 hits, 5 false detections and 0 misses. 1 available position comparison produces an average error of 388 nautical miles.
At the lead time of 9 days (216 hours), there were 1 hit, 4 false detections and 0 misses. 1 available position comparison produces an average error of 413 nautical miles.
At the lead time of 10 days (240 hours), there were 1 hit, 4 false detections and 2 misses. 1 available position comparison produces an average error of 466 nautical miles.
At the lead time of 11 days (264 hours), there were 1 hit, 3 false detections and 4 misses. 1 available position comparison produces an average error of 462 nautical miles.
At the lead time of 12 days (288 hours), there were 0 hits, 4 false detections and 6 misses. No available position comparisons.
At the lead time of 13 days (312 hours), there were 0 hits, 4 false detections and 6 misses. No available position comparisons.
At the lead time of 14 days (336 hours), there were 0 hits, 4 false detections and 5 misses. No available position comparisons.
At the lead time of 15 days (360 hours), there were 0 hits, 4 false detections and 2 misses. No available position comparisons.
At the lead time of 16 days (384 hours), there were 0 hits, 3 false detections and 2 misses. No available position comparisons.
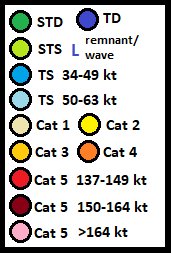
Circle coloration scheme


As of this analysis, best track positions are available July 3, 06Z thru July 8, 12Z, and as such, position comparisons are possible only for this timespan.
Getting out of the frame of East Pacific tracking map is considered equal to dissipation for the purpose of this verification.
Since I give only SSHS categories in my tracks, I don't calculate intensity errors in units of speed, but in categories. For this purpose, I define tropical or subtropical storms as "Category 0", tropical or subtropical depressions as "Category -1" and non-existence of a tropical or subtropical cyclone as "Category -2".
In the eight tracks, formation times ranged between July 5, 00Z and July 7, 12Z. Average was July 6, 00Z and median was July 5, 12Z.
In the 23 cases (8 tracks and 15 complete misses), peak intensity ranged between Category -2 and Category 5. Average was Category -0.35 and median was Category -2.
In the eight tracks, dissipation times ranged between July 11, 00Z and July 19, 12Z. Average was July 15, 04Z and median was July 14, 00Z.
At the lead time of 1 day (24 hours), there were 0 hits, 1 false detection and 0 misses. 1 available position comparison produces an average error of 526 nautical miles.
At the lead time of 2 days (48 hours), there were 1 hit, 2 false detections and 0 misses. 3 available position comparisons produce an average error of 295 nautical miles.
At the lead time of 3 days (72 hours), there were 2 hits, 1 false detection and 0 misses. 3 available position comparisons produce an average error of 305 nautical miles.
At the lead time of 4 days (96 hours), there were 2 hits, 2 false detections and 0 misses. 3 available position comparisons produce an average error of 319 nautical miles.
At the lead time of 5 days (120 hours), there were 2 hits, 3 false detections and 0 misses. 3 available position comparisons produce an average error of 347 nautical miles.
At the lead time of 6 days (144 hours), there were 3 hits, 3 false detections and 1 miss. 3 available position comparisons produce an average error of 394 nautical miles.
At the lead time of 7 days (168 hours), there were 2 hits, 4 false detections and 1 miss. 2 available position comparisons produce an average error of 442 nautical miles.
At the lead time of 8 days (192 hours), there were 0 hits, 5 false detections and 0 misses. 1 available position comparison produces an average error of 388 nautical miles.
At the lead time of 9 days (216 hours), there were 1 hit, 4 false detections and 0 misses. 1 available position comparison produces an average error of 413 nautical miles.
At the lead time of 10 days (240 hours), there were 1 hit, 4 false detections and 2 misses. 1 available position comparison produces an average error of 466 nautical miles.
At the lead time of 11 days (264 hours), there were 1 hit, 3 false detections and 4 misses. 1 available position comparison produces an average error of 462 nautical miles.
At the lead time of 12 days (288 hours), there were 0 hits, 4 false detections and 6 misses. No available position comparisons.
At the lead time of 13 days (312 hours), there were 0 hits, 4 false detections and 6 misses. No available position comparisons.
At the lead time of 14 days (336 hours), there were 0 hits, 4 false detections and 5 misses. No available position comparisons.
At the lead time of 15 days (360 hours), there were 0 hits, 4 false detections and 2 misses. No available position comparisons.
At the lead time of 16 days (384 hours), there were 0 hits, 3 false detections and 2 misses. No available position comparisons.
Circle coloration scheme
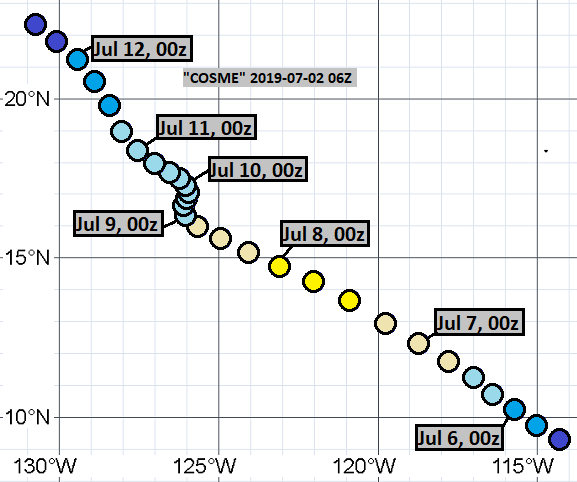
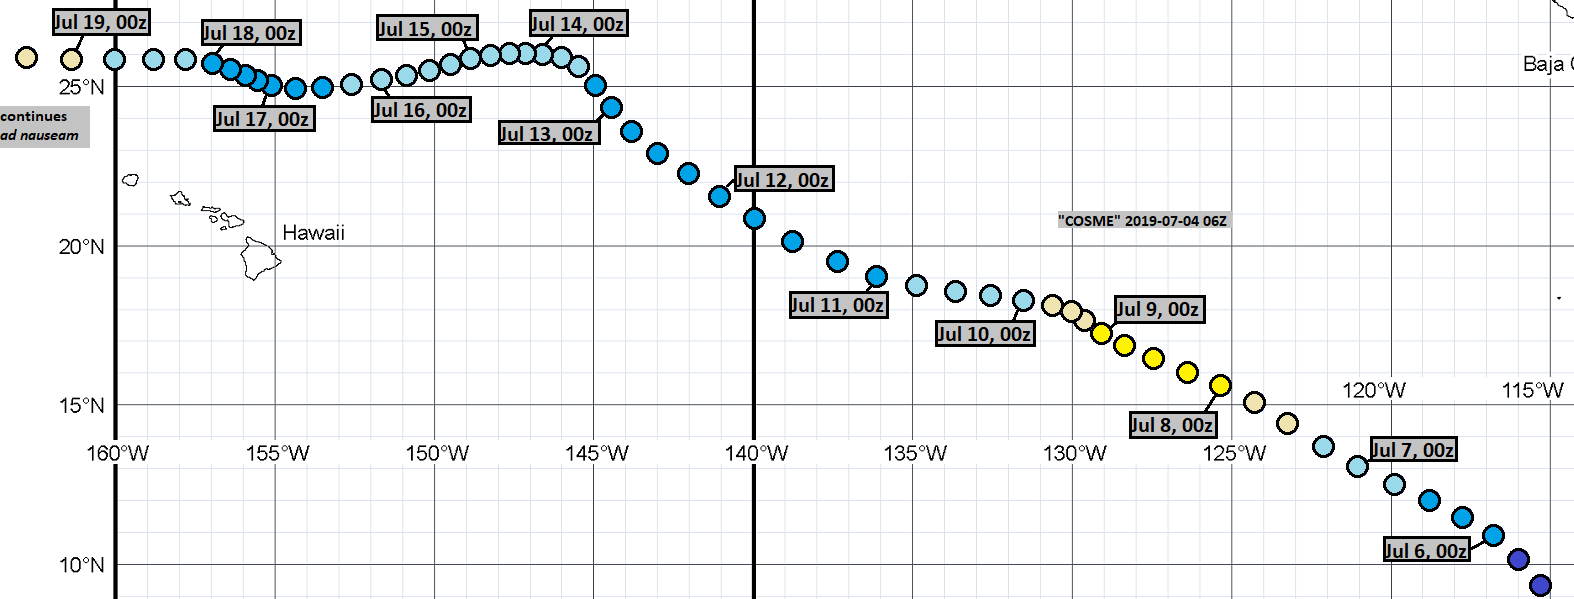
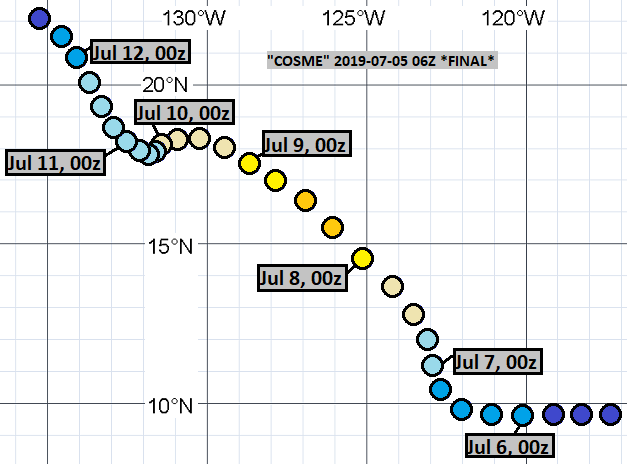
Here are the tracks once again.
June 27, 06Z run:
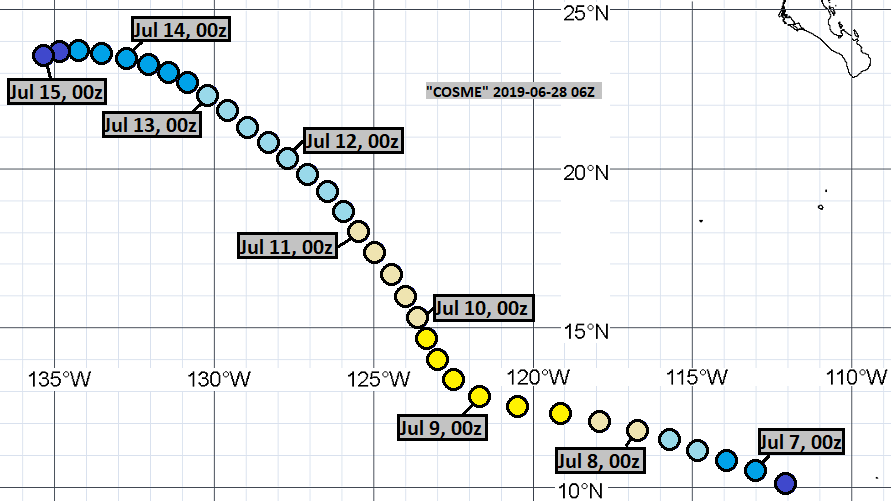
June 28, 06Z run:
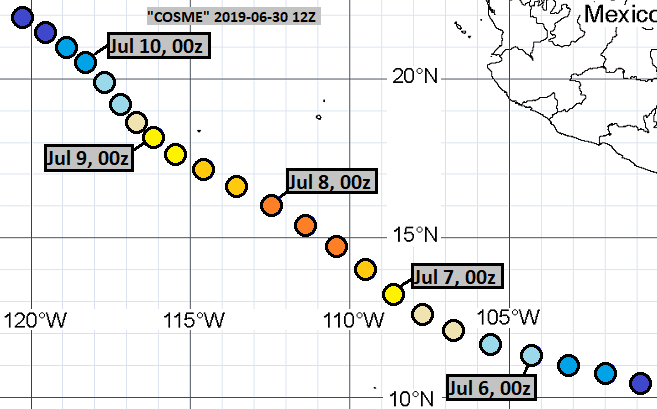
June 30, 12Z run:
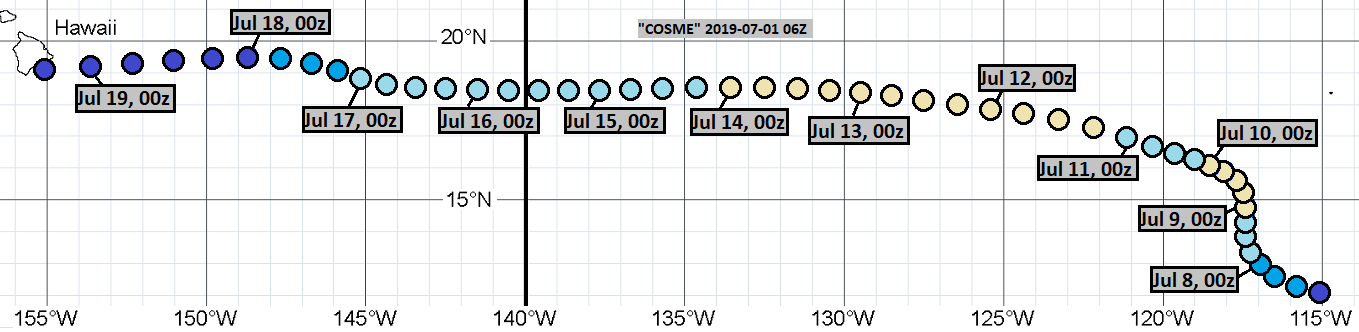
July 1, 06Z run:
July 2, 06Z run:
July 3, 06Z run:
July 4, 06Z run:
July 5, 06Z run:
The complete misses were from following runs:
June 20, 12Z
June 21, 06Z
June 22, 12Z
June 23, 06Z
June 23, 12Z
June 23, 18Z
June 24, 06Z
June 24, 12Z
June 24, 18Z
June 25, 06Z
June 25, 12Z
June 25, 18Z
June 26, 06Z
June 26, 12Z
June 30, 18Z


Comments
Post a Comment