Posts

Showing posts from November, 2019

In the year 2100 AD

Image
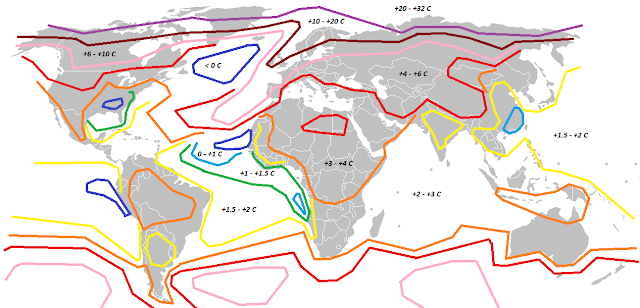
This is a repost of a Weather Underground blog post. By: elioe , 11:42 PM GMT on February 24, 2017  This vision assumes, that CO2 levels have risen to 1000 ppm (pretty much "business-as-usual"), no geoengineering has taken place, and no nuclear winter or exceptional volcanic winter has occurred. This blog entry will be subject to constant editing and additions, whenever my inspiration rages. General situation: Sea levels have risen 1.6 meters since 2017. Azores High has become "Cape Verde High" due to increased coastal upwelling. During winters, there is an additional "Mediterranean High". And during springs, there is a "Eastern U.S. High", which rarely gets intersected by passing troughs. In other oceanic basins, centers of subtropical highs have also moved towards the equator and towards the east. In "old conditions", during July-September, Sahara has had a string of surface lows, but the ascending motion at

Predictions for 2017 - mainly for entertainment purposes

Image
This is a repost of a Weather Underground blog post. By: elioe , 4:41 PM GMT on January 02, 2017  Totals for 2017 Atlantic hurricane season: 20 TDs/STDs, 18 TSs/STSs, 7 hurricanes, 3 major TD ONE : March 11 - March 12. Max. sustained winds 30 kt. Hurricane ARLENE : May 27 - June 1. Max. sustained winds 75 kt. Landfalls in Puerto Morelos, Quintana Roo, May 28, 40 kt ; Destin, Florida, May 31, 60 kt. STS BRET : June 10 - June 12. Max. sustained winds 35 kt. TS CINDY : June 15 - June 21. Max. sustained winds 60 kt. Landfalls on Bonaire & Curacao, June 17, 40 kt ; in Chichibacoa, Colombia, June 18, 40 kt ; Karawala, Nicaragua, June 20, 60 kt. TS DON : July 1 - July 4. Max. sustained winds 40 kt. TS EMILY : July 8 - July 14. Max. sustained winds 60 kt.   Tracks of storms from TD #1 to Emily. Colors same as used in Wikipedia, except light green for subtropical storm. Hurricane FRANKLIN : July 10 - July 18. Max. sustained winds 100 kt. Landfall

A very simple model to predict the effects from Megalake Chad

Image
This is a repost of a Weather Underground blog post. By: elioe , 10:22 PM GMT on November 03, 2016    I'm very fascinated by many possible geoengineering schemes, but one outstanding possibility is the filling of Lake Chad endorheic basin. The basin consists of two parts. The bottom of southern part contains Lake Chad, a lake with area of about 1,300 km² and a variable surface elevation between 278 and 286 meters AMSL. The bottom of northern part is the desert region of Bodele Depression. When filled to the lowest point on its water divide, a Megalake Chad would have an estimated area of 438,000 km² and a surface elevation of some 340 meters AMSL. It would contain a water volume of 18,000 km³, enough to lower world ocean levels by 5 cm. Any overflow to the Atlantic would happen via Benue and Niger River. The most plausible water sources are the Congo and Ubangi rivers. Those rivers have an elevation of 400 meters AMSL in their closest poi

My 2016 Hurricane season prediction and some other predictions (amateur)

Image
This is a repost of a Weather Underground blog post. By: elioe , 11:59 PM GMT on February 23, 2016  Totals for 2016 Atlantic hurricane season: 23 TDs/STDs, 21 TSs/STSs, 13 hurricanes, 5 major Hurricane BONNIE: June 2 - June 8. Max. sustained winds 90 kt. Landfall on Barbados, June 6, 85 kt. TS COLIN: June 5 - June 7. Max. sustained winds 40 kt. Landfall near Brownsville Texas, June 7, 40 kt. TD FOUR: July 1 - July 5. Max. sustained winds 30 kt. Landfall on Barbados, July 2, 30 kt. TS DANIELLE: July 14 - July 19. Max. sustained winds 55 kt. Landfalls on southern Jamaica coast, July 14, 35 kt ; at Cienfuegos Cuba, July 17, 55 kt ; at Key Largo Florida, July 17, 45 kt. TS EARL: July 17 - July 19. Max. sustained winds 40 kt. Landfall in Bilwi Nicaragua, July 19, 40 kt. TS FIONA: July 18 - July 25. Max. sustained winds 60 kt.   Fig. 1: Tracks of storms from Bonnie to Fiona, colors same as used in Wikipedia.   Hurricane GASTON: July 27

Verification of tracks made of Rebekah using GEFS mean fields

Image
I made three tracks of Subtropical Storm Rebekah. Additionally, within 384 hours of cyclogenesis, there were thirteen instances, when I missed cyclogenesis entirely. All the detections were at short lead times. As of this analysis, best track positions are available October 27, 06Z thru November 1, 06Z, and as such, position comparisons are possible only for this timespan.   Since I give only SSHS categories in my tracks, I don't calculate intensity errors in units of speed, but in categories. For this purpose, I define tropical or subtropical storms as "Category 0", tropical or subtropical depressions as "Category -1" and non-existence of a tropical or subtropical cyclone as "Category -2". In the three tracks, formation times ranged between October 30, 06Z and October 30, 12Z. Average was October 30, 08Z and median was October 30, 06Z. In the sixteen cases (3 tracks and 13 complete misses), peak intensity ranged between Ca

Verification of tracks made of Pablo using GEFS mean fields

Image
I made three tracks of Hurricane Pablo. Additionally, within 384 hours of cyclogenesis, there were ten instances, when I missed cyclogenesis entirely. All the tracks showed merely a subtropical cyclone. As of this analysis, best track positions are available October 24, 12Z thru October 28, 12Z, and as such, position comparisons are possible only for this timespan. Since I give only SSHS categories in my tracks, I don't calculate intensity errors in units of speed, but in categories. For this purpose, I define tropical or subtropical storms as "Category 0", tropical or subtropical depressions as "Category -1" and non-existence of a tropical or subtropical cyclone as "Category -2". In the three tracks, formation times ranged between October 25, 18Z and October 27, 18Z. Average was October 27, 00Z and median was October 27, 12Z. In the thirteen cases (3 tracks and 10 complete misses), peak intensity ranged between Category -2 and Categ

Verification of tracks made of Olga using GEFS mean fields

Image
I made two tracks of Tropical Storm Olga. Additionally, within 384 hours of cyclogenesis, there were eleven instances, when I missed cyclogenesis entirely. Detection rate was poor, but it's not surprising for a system, which lasted only six hours as a tropical cyclone. As of this analysis, best track positions are available October 23, 12Z thru October 26, 00Z, and as such, position comparisons are possible only for this timespan. Since I give only SSHS categories in my tracks, I don't calculate intensity errors in units of speed, but in categories. For this purpose, I define tropical or subtropical storms as "Category 0", tropical or subtropical depressions as "Category -1" and non-existence of a tropical or subtropical cyclone as "Category -2". In the two tracks, formation times ranged between October 25, 12Z and October 25, 18Z. Average and median was October 25, 15Z. In the thirteen cases (2 tracks and 11 complete misses)

Verification of tracks made of Nestor using GEFS mean fields

Image
I made four tracks of Tropical Storm Nestor. Additionally, within 384 hours of cyclogenesis, there were six instances, when I missed cyclogenesis entirely. As of this analysis, best track positions are available October 15, 18Z thru October 19, 18Z, and as such, position comparisons are possible only for this timespan. Since I give only SSHS categories in my tracks, I don't calculate intensity errors in units of speed, but in categories. For this purpose, I define tropical or subtropical storms as "Category 0", tropical or subtropical depressions as "Category -1" and non-existence of a tropical or subtropical cyclone as "Category -2". In the four tracks, formation times ranged between October 18, 00Z and October 20, 06Z. Average was October 18, 18Z and median was October 18, 09Z. In the ten cases (4 tracks and 6 complete misses), peak intensity ranged between Category -2 and Category 5. Average was Category -0.80 and median w

Verification of tracks made of TD 15 using GEFS mean fields

Image
I made six tracks of Tropical Depression Fifteen. Additionally, within 384 hours of cyclogenesis, there were four instances, when I missed cyclogenesis entirely. As of this analysis, best track positions are available October 12, 12Z thru October 16, 06Z, and as such, position comparisons are possible only for this timespan. Since I give only SSHS categories in my tracks, I don't calculate intensity errors in units of speed, but in categories. For this purpose, I define tropical or subtropical storms as "Category 0", tropical or subtropical depressions as "Category -1" and non-existence of a tropical or subtropical cyclone as "Category -2". In the six tracks, formation times ranged between October 14, 06Z and October 15, 18Z. Average was October 15, 04Z and median was October 15, 09Z. In the ten cases (6 tracks and 4 complete misses), peak intensity ranged between Category -2 and Category 2. Average was Category -0.20 and median was

Verification of non-detection of Melissa

I made no tracks of Tropical Storm Melissa. Within 384 hours of cyclogenesis, there were eleven instances, where I missed cyclogenesis. At the lead time of 1 day ( 24 hours), there was 1 miss. At the lead time of 2 days ( 48 hours), there was 1 miss. At the lead time of 3 days ( 72 hours), there were 2 misses. At the lead time of 4 days ( 96 hours), there was 1 miss. At the lead time of 5 days ( 120 hours), there were 2 misses. At the lead time of 6 days ( 144 hours), there was 1 miss. At the lead time of 7 days ( 168 hours), there were 2 misses. At the lead time of 8 days ( 192 hours), there was 1 miss. At the lead time of 9 days ( 216 hours), there were 2 misses. At the lead time of 10 days ( 240 hours), there were 2 misses. At the lead time of 11 days ( 264 hours), there were 3 misses. At the lead time of 12 days ( 288 hours), there were 3 misses. At the lead time of 13 days ( 312 hours), there were 2 misses. At the lead time of