My 2016 Hurricane season prediction and some other predictions (amateur)
This is a repost of a Weather Underground blog post.
By: elioe , 11:59 PM GMT on February 23, 2016

Hurricane GASTON: July 27 - August 10. Max. sustained winds 130 kt.
Hurricane HERMINE: August 3 - August 18. Max. sustained winds 150 kt. Landfalls on Grenada, August 7, 140 kt ; north of Belize City, August 13, 120 kt ; at Tecolutla Veracruz, August 17, 65 kt.
TS IAN: August 4 - August 7. Max. sustained winds 55 kt. Landfalls on Cayman Brac, August 5, 45 kt ; on Isle of Youth, August 6, 50 kt; at Pinar del Rio, August 7, 40 kt.
Hurricane JULIA: August 6 - August 15. Max. sustained winds 80 kt. Landfall on Flores Island Azores, August 14, 65 kt.
Hurricane KARL: August 14 - August 19. Max. sustained winds 75 kt. Landfalls near Kingston Jamaica, August 16, 75 kt ; at Pinar del Rio, August 18, 35 kt.
Hurricane LISA: August 20 - August 23. Max. sustained winds 70 kt. Landfalls at Mayaro Trinidad, August 22, 70 kt ; in Venezuela east of Guariquen, August 22, 65 kt.
 Fig. 2: Tracks of storms from Gaston to Lisa, colors same as used in Wikipedia.
Hurricane MATTHEW: August 29 - September 12. Max. sustained winds 145 kt. Landfalls on Antigua, September 3, 65 kt ; on Nevis, September 4, 65 kt ; on St. Croix, September 4, 80 kt ; on Vieques, September 5, 85 kt ; at Roosevelt Roads Puerto Rico, September 5, 85 kt ; on Great Inagua, September 6, 110 kt ; at Ocracoke North Carolina, September 11, 105 kt. Passing 20 miles east of Miami while at peak intensity.
TS NICOLE: August 31 - September 3. Max. sustained winds 50 kt. Movement generally south, reaching 2.5 degrees north.
STS OTTO: September 7 - September 13. Max. sustained winds 55 kt. Landfalls at Shelburne Nova Scotia, September 12, 50 kt ; at St.Martins New Brunswick, September 12, 45 kt.
Hurricane PAULA: September 9 - September 15. Max. sustained winds 70 kt. Landfall on eastern Yucatan Peninsula coast, September 10, 40 kt. Peak intensity on September 13, drifting near Louisiana coastline from peak intensity until dissipation.
Hurricane RICHARD: September 20 - September 29. Max. sustained winds 90 kt. Landfall on Terceira Island Azores, September 27, 60 kt.
Hurricane SHARY: September 23 - September 26 (exits basin). Max. sustained winds 110 kt. Landfall at Reserva Biológica Indio Maíz (Nicaragua), September 25, 100 kt. Enters the Pacific as a tropical storm.
 Fig. 3: Tracks of storms from Matthew to Shary, colors same as used in Wikipedia, except dark green for STD and light green for STS.
TD TWENTY: October 5 - October 7. Max. sustained winds 30 kt. Landfall at El Mezquital Tamaulipas, October 6, 30 kt.
Hurricane TOBIAS: October 24 - October 30. Max. sustained winds 110 kt. Landfall at Clearwater Florida, October 27, 110 kt.
Hurricane VIRGINIE: November 10 - November 14. Max. sustained winds 95 kt. Landfall at Exmore Virginia, November 14, 70 kt.
TS WALTER: December 10 - December 13. Max. sustained winds 40 kt. Landfall at San Juan Puerto Rico, December 13, 25 kt.
 Fig. 4: Tracks of storms from TD #20 to Walter, colors same as used in Wikipedia, except dark green for STD and light green for STS.
Arctic sea ice minimum: 3.59 million sq km. From March to May, Chukotkan and Alaskan sides of the ocean will see more surface layer convergence than average. Lots of Pacific water will flow through Bering Strait, bringing heat. Meanwhile, heat of Atlantic surface waters flows strongly towards North Pole. For the rest of melt season, there will be above average divergence of surface layer all the way from Greenland to Severnaya Zemlya, including areas near Svalbard and Franz Josef Land. That results in more upwelling of heat from below the halocline. However, as melt season progresses, the remaining ice cover is thick due to convergence, and therefore hard to melt. So, for the next few months, sea ice cover will be record low by a large margin, but later the melting slows down, and the minimum is only slightly below 2012 values.
Totals for 2016 Pacific hurricane season east of 140 degrees west: 13 TDs, 12 TSs, 6 hurricanes, 3 major
Totals for 2016 Pacific hurricane season west of 140 degrees west: 9 TDs, 8 TSs, 4 hurricanes, 2 major (including those that originate from East Pacific)
Totals for 2016 Pacific typhoon season: 26 TDs, 20 TSs, 11 typhoons, 2 super typhoons
Totals for 2016 North Indian Ocean cyclone season: 5 depressions, 2 cyclonic storms, 1 super cyclonic storm
Niño 3.4 values: +2.0C on March 1, +1.3C on April 1, +0.7C on May 1, +0.2C on June 1, +0.0C on July 1, +0.2C on August 1, +0.5C on September 1, +0.7C on October 1, +0.9C on November 1, +1.0C on December 1
By: elioe , 11:59 PM GMT on February 23, 2016
Totals for 2016 Atlantic hurricane season: 23 TDs/STDs, 21 TSs/STSs, 13 hurricanes, 5 major
Hurricane BONNIE: June 2 - June 8. Max. sustained winds 90 kt. Landfall on Barbados, June 6, 85 kt.
TS COLIN: June 5 - June 7. Max. sustained winds 40 kt. Landfall near Brownsville Texas, June 7, 40 kt.
TD FOUR: July 1 - July 5. Max. sustained winds 30 kt. Landfall on Barbados, July 2, 30 kt.
TS DANIELLE: July 14 - July 19. Max. sustained winds 55 kt. Landfalls on southern Jamaica coast, July 14, 35 kt ; at Cienfuegos Cuba, July 17, 55 kt ; at Key Largo Florida, July 17, 45 kt.
TS EARL: July 17 - July 19. Max. sustained winds 40 kt. Landfall in Bilwi Nicaragua, July 19, 40 kt.
TS FIONA: July 18 - July 25. Max. sustained winds 60 kt.
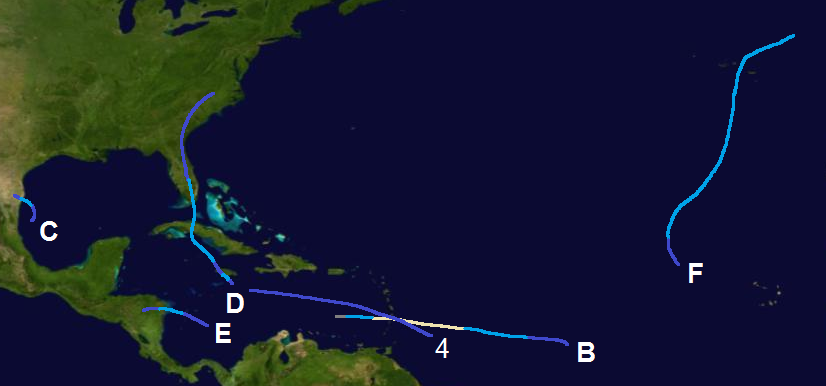
Fig. 1: Tracks of storms from Bonnie to Fiona, colors same as used in Wikipedia.
Hurricane GASTON: July 27 - August 10. Max. sustained winds 130 kt.
Hurricane HERMINE: August 3 - August 18. Max. sustained winds 150 kt. Landfalls on Grenada, August 7, 140 kt ; north of Belize City, August 13, 120 kt ; at Tecolutla Veracruz, August 17, 65 kt.
TS IAN: August 4 - August 7. Max. sustained winds 55 kt. Landfalls on Cayman Brac, August 5, 45 kt ; on Isle of Youth, August 6, 50 kt; at Pinar del Rio, August 7, 40 kt.
Hurricane JULIA: August 6 - August 15. Max. sustained winds 80 kt. Landfall on Flores Island Azores, August 14, 65 kt.
Hurricane KARL: August 14 - August 19. Max. sustained winds 75 kt. Landfalls near Kingston Jamaica, August 16, 75 kt ; at Pinar del Rio, August 18, 35 kt.
Hurricane LISA: August 20 - August 23. Max. sustained winds 70 kt. Landfalls at Mayaro Trinidad, August 22, 70 kt ; in Venezuela east of Guariquen, August 22, 65 kt.

Hurricane MATTHEW: August 29 - September 12. Max. sustained winds 145 kt. Landfalls on Antigua, September 3, 65 kt ; on Nevis, September 4, 65 kt ; on St. Croix, September 4, 80 kt ; on Vieques, September 5, 85 kt ; at Roosevelt Roads Puerto Rico, September 5, 85 kt ; on Great Inagua, September 6, 110 kt ; at Ocracoke North Carolina, September 11, 105 kt. Passing 20 miles east of Miami while at peak intensity.
TS NICOLE: August 31 - September 3. Max. sustained winds 50 kt. Movement generally south, reaching 2.5 degrees north.
STS OTTO: September 7 - September 13. Max. sustained winds 55 kt. Landfalls at Shelburne Nova Scotia, September 12, 50 kt ; at St.Martins New Brunswick, September 12, 45 kt.
Hurricane PAULA: September 9 - September 15. Max. sustained winds 70 kt. Landfall on eastern Yucatan Peninsula coast, September 10, 40 kt. Peak intensity on September 13, drifting near Louisiana coastline from peak intensity until dissipation.
Hurricane RICHARD: September 20 - September 29. Max. sustained winds 90 kt. Landfall on Terceira Island Azores, September 27, 60 kt.
Hurricane SHARY: September 23 - September 26 (exits basin). Max. sustained winds 110 kt. Landfall at Reserva Biológica Indio Maíz (Nicaragua), September 25, 100 kt. Enters the Pacific as a tropical storm.

TD TWENTY: October 5 - October 7. Max. sustained winds 30 kt. Landfall at El Mezquital Tamaulipas, October 6, 30 kt.
Hurricane TOBIAS: October 24 - October 30. Max. sustained winds 110 kt. Landfall at Clearwater Florida, October 27, 110 kt.
Hurricane VIRGINIE: November 10 - November 14. Max. sustained winds 95 kt. Landfall at Exmore Virginia, November 14, 70 kt.
TS WALTER: December 10 - December 13. Max. sustained winds 40 kt. Landfall at San Juan Puerto Rico, December 13, 25 kt.

Arctic sea ice minimum: 3.59 million sq km. From March to May, Chukotkan and Alaskan sides of the ocean will see more surface layer convergence than average. Lots of Pacific water will flow through Bering Strait, bringing heat. Meanwhile, heat of Atlantic surface waters flows strongly towards North Pole. For the rest of melt season, there will be above average divergence of surface layer all the way from Greenland to Severnaya Zemlya, including areas near Svalbard and Franz Josef Land. That results in more upwelling of heat from below the halocline. However, as melt season progresses, the remaining ice cover is thick due to convergence, and therefore hard to melt. So, for the next few months, sea ice cover will be record low by a large margin, but later the melting slows down, and the minimum is only slightly below 2012 values.
Totals for 2016 Pacific hurricane season east of 140 degrees west: 13 TDs, 12 TSs, 6 hurricanes, 3 major
Totals for 2016 Pacific hurricane season west of 140 degrees west: 9 TDs, 8 TSs, 4 hurricanes, 2 major (including those that originate from East Pacific)
Totals for 2016 Pacific typhoon season: 26 TDs, 20 TSs, 11 typhoons, 2 super typhoons
Totals for 2016 North Indian Ocean cyclone season: 5 depressions, 2 cyclonic storms, 1 super cyclonic storm
Niño 3.4 values: +2.0C on March 1, +1.3C on April 1, +0.7C on May 1, +0.2C on June 1, +0.0C on July 1, +0.2C on August 1, +0.5C on September 1, +0.7C on October 1, +0.9C on November 1, +1.0C on December 1

Comments
Post a Comment