A very simple model to predict the effects from Megalake Chad
This is a repost of a Weather Underground blog post.
By: elioe , 10:22 PM GMT on November 03, 2016

Based on the GFS predictions for next 16 days, typical November temperature over the area to be Megalake Chad is 26.25 degrees Celsius. Relative humidity is near 20%. Wind speed is assumed to be 5 m/s. Its direction in surface layer is assumed to be to WSW, whenever the air is above water surface, and to SW, whenever the air is above land. If the air becomes unstable and begins rising, the direction is assumed to be towards west. The maximum extent of Megalake Chad is 963 km in the WSW-ENE direction.
A string of surface low pressure centers extends from Senegal to South Sudan via Burkina Faso and Southern Chad. That low pressure does not extend to 850 mbar level, and peak rainfall is near the equator.

In Figure 2 it is seen, that despite the need for latent heat in evaporation, temperature begins to increase immediately, especially since the lake is releasing stored heat. The mixing ratio for water vapor, that is eventually attained, is 17 g/kg.

In figure 3, a small region of slight stability is seen between 820 mbar and 890 mbar levels. However, below 890 mbar surface, the air, that has gone above Megalake Chad, is much warmer. It can be assumed, that the air is more than capable of breaking through the stable levels by that point. Most likely, deep convection ensues after the air has been over the lake for a distance between 650 and 800 kilometers.
The estimated average rainfall rates are 4 mm/day near Maiduguri (that city itself being covered by the lake), 2 mm/day in Niamey (capital city of Niger) and 1 mm/day in Bamako (the capital city of Mali). The current average November monthly precipitation totals for those cities are 0.0 mm, 0.7 mm and 5.7 mm, respectively.
Lots of moisture gets into air, that does not traverse over Megalake Chad for 650 km or more. That moisture moves to the southwest, never becoming unstable before entering Gulf of Guinea.
Non-linear, non-stationary effects: The wind direction and velocity are not entirely constant. Some of the precipitation is going to end up to places to the SW of the lake, or to the NW of the lake. The shift of entire November position of ITCZ from DR Congo to Chad is possible.
Also from GFS projections it is seen, that wind shear levels above Chad are often very low. Tropical cyclogenesis in November in western portions of Megalake Chad can not be ruled out.
September
From June to September, the setup is entirely different, since the string of surface lows is north of Megalake Chad. In September, ITCZ-related rainfall is plentiful in southern and central parts of Chad.
Now the typical surface temperature is set at 30.75 degrees Celsius, relative humidity at 40%. Surface wind speed is assumed to be 2.5 m/s. Its direction is to ENE over the lake and to NE over land areas. At higher altitudes, the wind speed is 1 m/s to west.

During early September, the lake is expected to store more heat. As a result, as seen in Figure 4, the air temperature originally decreases, as the air starts to become more humid and loses sensible heat to evaporation. However, after just 100 km or so, the warming effect of radiation imbalance and increased absorption of sunlight reverses the trend. The final mixing ratio of water vapor in the surface layer is 28 g/kg.
From Figure 5 it is evident, that there's not much stability to stop the air coming above Megalake Chad from rising. Most likely, the rising motion begins somewhere between 560 and 680 km from the point, where journey across the lake begins.
The estimated rainfall rates are 30 mm/day near Mao and all along the northwestern coast of Megalake Chad, where typical annual rainfall is less than 200 mm, commonly less than 100 mm. In Agadez, rainfall increases by 1.5 mm/day.
Non-linear, non-stationary effects: The increase in both latent and sensible heat certainly causes the ITCZ to move from southern Chad to northern Chad. That eliminates the assumption, that the rising air would move to west. Bulk of the precipitation is likely to fall to the NE of the lake. However, variations in weather cause precipitation on all sides of the lake. Also, the precipitation is enhances by lots of moisture, which does not originate from the Megalake Chad basin.
---
The following added on November 16.
Times of stagnation
In both mid-May and late September, the string of lows goes directly above the bulk of Megalake Chad. Typical temperatures in mid-May are 32.75 degrees Celsius, relative humidity at 20% and the net absorption of heat by the lake is 40 W/m². Typical temperatures in late September are 29.25 degrees Celsius, relative humidity at 35% and there is no change in the heat storage of the lake. In both cases, there is no wind at the surface. If the air rises, it will move to the west at 2.5 m/s.
Due to no surface movement, in this model, the air automatically rises in situ. In the case of mid-May, the air must be above the lake for four days, until the balance between evaporation and increased sunlight absorption can make the air less dense than its surroundings. By that time, water vapor content has risen into 25 g/kg. In late September, the air must be above the lake for 18 hours. Water vapor content rises into 13 g/kg.
Near Maiduguri and Mao, rainfall peaks at 70 and 35 mm/day in mid-May and late September, respectively. In Niamey, the rainfall rates are 18 and 9 mm/day. In Bamako, 4 and 2 mm/day.
Times of stability
The air travelling above Megalake Chad will remain stable until reaching Gulf of Guinea for the period roughly between New Year's Day and mid-August, with the exception of the vicinity of mid-May "time of stagnation".
Total results
Figure 6 shows the extra rainfall rates near Maiduguri, Niamey and Bamako, as produced by the model, compared with current rainfall rates from Wikipedia.

And finally, in Figure 7, a rather artistic representation of the my prediction about changes in rainfall. Not only including results of this simple model, but also trying to grasp such subjects as variable wind speed, variable cloud cover above the lake, shift of the ITCZ, moisture getting into frontal boundaries...

Conclusion
Filling of Lake Chad to the lowest point on its water divide would likely have huge positive impacts on its surroundings, far beyond the damage done to property that gets inundated. However, a much better model would be needed to confirm it and get more deeply into specifics.
By: elioe , 10:22 PM GMT on November 03, 2016
I'm very fascinated by many possible geoengineering schemes, but one
outstanding possibility is the filling of Lake Chad endorheic basin. The
basin consists of two parts. The bottom of southern part contains Lake
Chad, a lake with area of about 1,300 km² and a variable surface
elevation between 278 and 286 meters AMSL. The bottom of northern part
is the desert region of Bodele Depression. When filled to the lowest
point on its water divide, a Megalake Chad would have an estimated area
of 438,000 km² and a surface elevation of some 340 meters AMSL. It would
contain a water volume of 18,000 km³, enough to lower world ocean
levels by 5 cm. Any overflow to the Atlantic would happen via Benue and
Niger River. The most plausible water sources are the Congo and Ubangi
rivers. Those rivers have an elevation of 400 meters AMSL in their
closest point to Lake Chad watershed. Given a sufficiently large tunnel,
all of the waters of those rivers at that point could flow to Megalake
Chad without any operational costs. Outline is given in Figure 1. To
estimate crudely the weather and climate impacts of this filling, I
devised a simple model.
In the model, lowest 100 mbar of air makes up a completely mixed surface layer, which is originally stable in regard to the air above it. The motion of that air is based on current typical values. In current typical air temperatures, the radiation leaving the surface beneath it is assumed to be in equilibrium with incoming radiation, which is being absorbed. A change in the air temperature by one degree Celsius causes a radiation imbalance of 5 W/m². The lake surface absorbs 150 W/m² more than surrounding arid land areas. The lake stores heat at 66.581 W/m² during summer solstice, releases heat at 66.581 W/m² during winter solstice, with a sinusoidal curve connecting those extremes. Evaporation is linearly related to the difference between vapor pressure and the partial pressure of water vapor at surface. At 30 degrees Celsius and relative humidity of 0%, the value is 127.4 mg/m²/s. If the air rises, it is assumed to lose approximately 1% of its moisture as precipitation in one hour, corresponding roughly to a vertical motion of -12 mbar/hour.
In the model, lowest 100 mbar of air makes up a completely mixed surface layer, which is originally stable in regard to the air above it. The motion of that air is based on current typical values. In current typical air temperatures, the radiation leaving the surface beneath it is assumed to be in equilibrium with incoming radiation, which is being absorbed. A change in the air temperature by one degree Celsius causes a radiation imbalance of 5 W/m². The lake surface absorbs 150 W/m² more than surrounding arid land areas. The lake stores heat at 66.581 W/m² during summer solstice, releases heat at 66.581 W/m² during winter solstice, with a sinusoidal curve connecting those extremes. Evaporation is linearly related to the difference between vapor pressure and the partial pressure of water vapor at surface. At 30 degrees Celsius and relative humidity of 0%, the value is 127.4 mg/m²/s. If the air rises, it is assumed to lose approximately 1% of its moisture as precipitation in one hour, corresponding roughly to a vertical motion of -12 mbar/hour.

Figure 1: Outline of typical annual minimum extent of
Lake Chad in red. Outline of typical annual maximum extent of Lake Chad
in green. Outline of Megalake Chad in blue.
November
Based on the GFS predictions for next 16 days, typical November temperature over the area to be Megalake Chad is 26.25 degrees Celsius. Relative humidity is near 20%. Wind speed is assumed to be 5 m/s. Its direction in surface layer is assumed to be to WSW, whenever the air is above water surface, and to SW, whenever the air is above land. If the air becomes unstable and begins rising, the direction is assumed to be towards west. The maximum extent of Megalake Chad is 963 km in the WSW-ENE direction.
A string of surface low pressure centers extends from Senegal to South Sudan via Burkina Faso and Southern Chad. That low pressure does not extend to 850 mbar level, and peak rainfall is near the equator.

Figure 2: Horizontal axis: distance from the point,
where the streamline comes above the lake. Black thick line indicates,
when the lake ends. Vertical axis, from top to bottom: Temperature in
degrees Celsius; relative humidity; density compared to initial density.
In Figure 2 it is seen, that despite the need for latent heat in evaporation, temperature begins to increase immediately, especially since the lake is releasing stored heat. The mixing ratio for water vapor, that is eventually attained, is 17 g/kg.

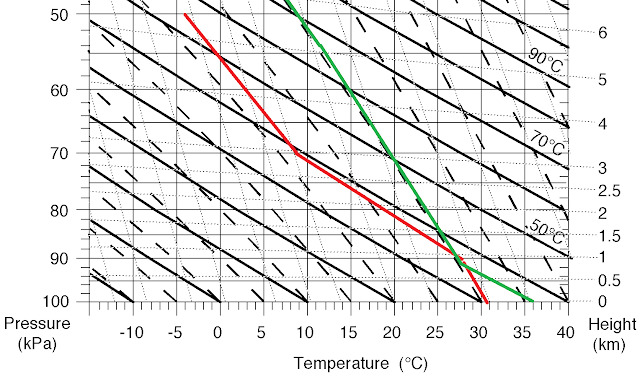
Figure 3: An emagram containing the temperature vs.
pressure for real-life air above Lake Chad basin (red) and above central
DR Congo, where most of tropical precipitation falls at this time of
year (blue), as well as for the air, that has traversed Megalake Chad,
if it rises (green)
In figure 3, a small region of slight stability is seen between 820 mbar and 890 mbar levels. However, below 890 mbar surface, the air, that has gone above Megalake Chad, is much warmer. It can be assumed, that the air is more than capable of breaking through the stable levels by that point. Most likely, deep convection ensues after the air has been over the lake for a distance between 650 and 800 kilometers.
The estimated average rainfall rates are 4 mm/day near Maiduguri (that city itself being covered by the lake), 2 mm/day in Niamey (capital city of Niger) and 1 mm/day in Bamako (the capital city of Mali). The current average November monthly precipitation totals for those cities are 0.0 mm, 0.7 mm and 5.7 mm, respectively.
Lots of moisture gets into air, that does not traverse over Megalake Chad for 650 km or more. That moisture moves to the southwest, never becoming unstable before entering Gulf of Guinea.
Non-linear, non-stationary effects: The wind direction and velocity are not entirely constant. Some of the precipitation is going to end up to places to the SW of the lake, or to the NW of the lake. The shift of entire November position of ITCZ from DR Congo to Chad is possible.
Also from GFS projections it is seen, that wind shear levels above Chad are often very low. Tropical cyclogenesis in November in western portions of Megalake Chad can not be ruled out.
September
From June to September, the setup is entirely different, since the string of surface lows is north of Megalake Chad. In September, ITCZ-related rainfall is plentiful in southern and central parts of Chad.
Now the typical surface temperature is set at 30.75 degrees Celsius, relative humidity at 40%. Surface wind speed is assumed to be 2.5 m/s. Its direction is to ENE over the lake and to NE over land areas. At higher altitudes, the wind speed is 1 m/s to west.

Figure 4: Horizontal axis: distance from the point,
where the streamline comes above the lake. Black thick line indicates,
when the lake ends. Vertical axis, from top to bottom: Temperature in
degrees Celsius; relative humidity; density compared to initial density.
During early September, the lake is expected to store more heat. As a result, as seen in Figure 4, the air temperature originally decreases, as the air starts to become more humid and loses sensible heat to evaporation. However, after just 100 km or so, the warming effect of radiation imbalance and increased absorption of sunlight reverses the trend. The final mixing ratio of water vapor in the surface layer is 28 g/kg.
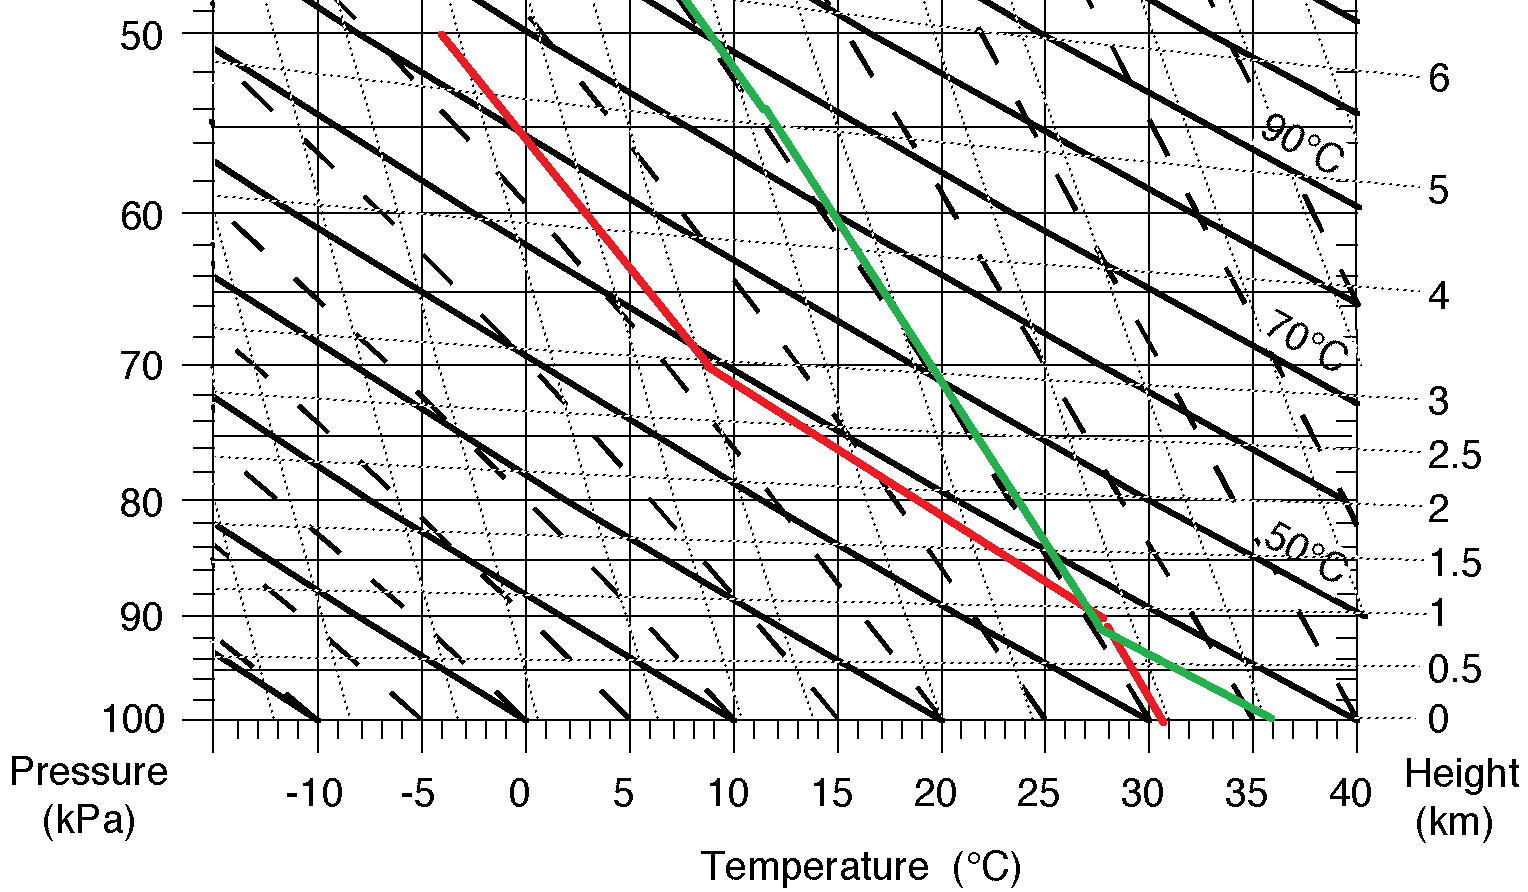
Figure 5: An emagram containing the (poorly estimated)
temperature vs. pressure for real-life air above Lake Chad basin (red)
and for the air, that has traversed Megalake Chad, if it rises (green)
From Figure 5 it is evident, that there's not much stability to stop the air coming above Megalake Chad from rising. Most likely, the rising motion begins somewhere between 560 and 680 km from the point, where journey across the lake begins.
The estimated rainfall rates are 30 mm/day near Mao and all along the northwestern coast of Megalake Chad, where typical annual rainfall is less than 200 mm, commonly less than 100 mm. In Agadez, rainfall increases by 1.5 mm/day.
Non-linear, non-stationary effects: The increase in both latent and sensible heat certainly causes the ITCZ to move from southern Chad to northern Chad. That eliminates the assumption, that the rising air would move to west. Bulk of the precipitation is likely to fall to the NE of the lake. However, variations in weather cause precipitation on all sides of the lake. Also, the precipitation is enhances by lots of moisture, which does not originate from the Megalake Chad basin.
---
The following added on November 16.
Times of stagnation
In both mid-May and late September, the string of lows goes directly above the bulk of Megalake Chad. Typical temperatures in mid-May are 32.75 degrees Celsius, relative humidity at 20% and the net absorption of heat by the lake is 40 W/m². Typical temperatures in late September are 29.25 degrees Celsius, relative humidity at 35% and there is no change in the heat storage of the lake. In both cases, there is no wind at the surface. If the air rises, it will move to the west at 2.5 m/s.
Due to no surface movement, in this model, the air automatically rises in situ. In the case of mid-May, the air must be above the lake for four days, until the balance between evaporation and increased sunlight absorption can make the air less dense than its surroundings. By that time, water vapor content has risen into 25 g/kg. In late September, the air must be above the lake for 18 hours. Water vapor content rises into 13 g/kg.
Near Maiduguri and Mao, rainfall peaks at 70 and 35 mm/day in mid-May and late September, respectively. In Niamey, the rainfall rates are 18 and 9 mm/day. In Bamako, 4 and 2 mm/day.
Times of stability
The air travelling above Megalake Chad will remain stable until reaching Gulf of Guinea for the period roughly between New Year's Day and mid-August, with the exception of the vicinity of mid-May "time of stagnation".
Total results
Figure 6 shows the extra rainfall rates near Maiduguri, Niamey and Bamako, as produced by the model, compared with current rainfall rates from Wikipedia.
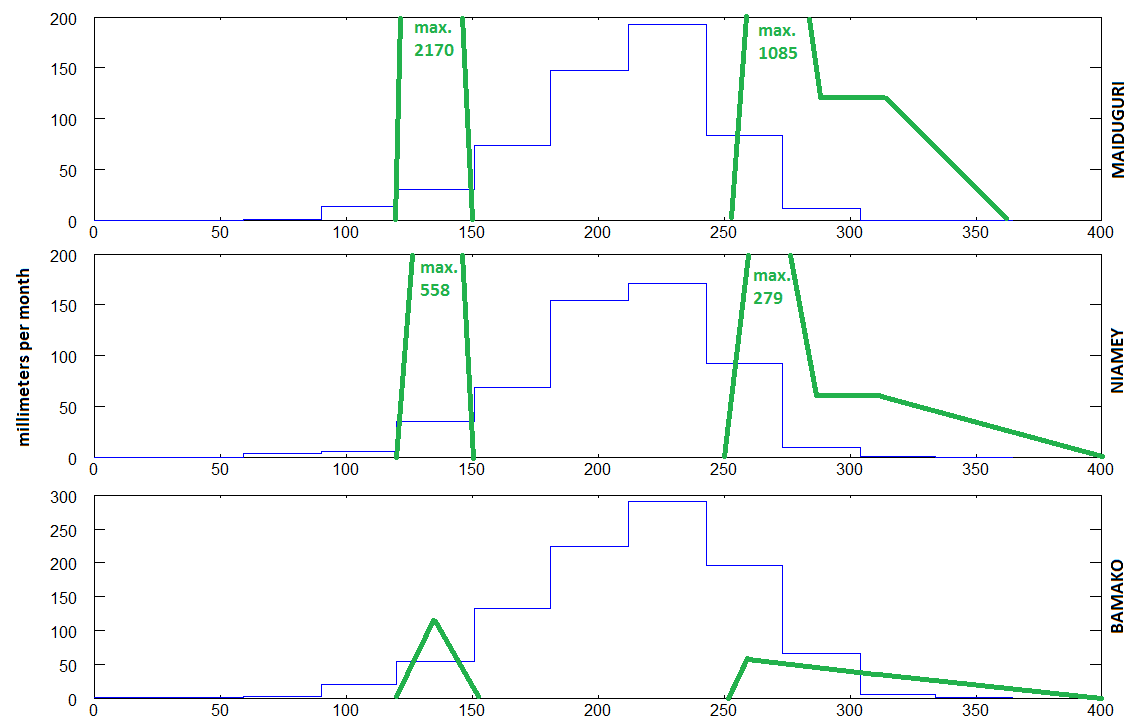
Figure 6: Current rainfall rates for Maiduguri (top),
Niamey (middle) and Bamako (bottom), with an accuracy of one month, as
given in Wikipedia (blue). Extra rainfall given by the model, and as
interpolated between calculation points. (green)
And finally, in Figure 7, a rather artistic representation of the my prediction about changes in rainfall. Not only including results of this simple model, but also trying to grasp such subjects as variable wind speed, variable cloud cover above the lake, shift of the ITCZ, moisture getting into frontal boundaries...

Figure 7: Artistic representation of differences in annual rainfall caused by the filling of Megalake Chad.
Conclusion
Filling of Lake Chad to the lowest point on its water divide would likely have huge positive impacts on its surroundings, far beyond the damage done to property that gets inundated. However, a much better model would be needed to confirm it and get more deeply into specifics.


Comments
Post a Comment