Verification of tracks made on Harvey (2017) using GEFS mean fields
This is a repost from late 2017
I made five tracks about Hurricane Harvey. Additionally, there were seven runs, where I missed the system entirely. My predicted intensity was consistently way too low. In my tracks, Harvey progressed west pretty near the actual track of the hurricane, but differences in timing caused position errors to be enormous. I generally projected Harvey to be a short-lived cyclone in the West Caribbean. It is pretty comical, because in reality, Harvey had degenerated, and not yet regenerated, when in that region.
None of my tracks began before the first best track entry as TC at August 17, 18Z. None of my tracks continued after the last best track entry as TC at August 31, 00Z. Therefore, these times are the limits to my analysis.
Since I give only SSHS categories in my tracks, I don't calculate intensity errors in units of speed, but in categories. For this purpose, I define tropical storms as "Category 0", tropical depressions as "Category -1" and non-existence of a tropical cyclone as "Category -2".
I compare intensities only in cases, when either the best track data or my track has a tropical cyclone, or both. In other words, I leave the comparison out of calculations, if both best track data and my track lack a tropical cyclone.
In the five tracks, formation times ranged between August 18, 12Z and August 23, 18Z. Median was August 21, 06Z and average was August 20, 19Z.
The 12 peak intensities (those seven complete misses included) ranged between non-formation (Category -2) to Category 1. Median was Category -2 and average was Category -1.1.
Dissipation times ranged between August 20, 12Z and August 26, 18Z. Median was August 22, 12Z and average was August 22, 20Z.
The following lines will have the format:
lead time ... number of true detections ... number of misses ... number of false detections ... number of position comparisons ... number of intensity comparisons ... average error in intensity category ... bias in intensity category ... average error in latitude ... bias in latitude ... average error in longitude ... bias in longitude ... upper limit for scalar error in position (nautical miles)... calculated scalar bias in position (nautical miles)
168h ... 0 ... 1 ... 1 ... 1 ... 2 ... 2.0 ... 0.0 ... 1.4 ... 1.4S ... 0.3 ... 0.3W ... 90 ... 90
192h ... 0 ... 2 ... 1 ... 1 ... 3 ... 1.7 ... -1.0 ... 3.8 ... 3.8S ... 0.5 ... 0.5E ... 230 ... 230
216h ... 0 ... 4 ... 0 ... 0 ... 4 ... 1.8 ... -1.8 ... N/A ... N/A ... N/A ... N/A ... N/A ... N/A
240h ... 1 ... 1 ... 0 ... 1 ... 2 ... 2.5 ... -2.5 ... 0.7 ... 0.7S ... 14.2 ... 14.2W ... 830 ... 830
264h ... 0 ... 1 ... 0 ... 0 ... 1 ... 5.0 ... -5.0 ... N/A ... N/A ... N/A ... N/A ... N/A ... N/A
288h ... 0 ... 1 ... 1 ... 1 ... 2 ... 1.5 ... -0.5 ... 4.1 ... 4.1S ... 1.6 ... 1.6E ... 260 ... 260
312h ... 1 ... 1 ... 0 ... 1 ... 2 ... 1.0 ... -1.0 ... 6.7 ... 6.7S ... 13.6 ... 13.6E ... 890 ... 890
336h ... 1 ... 3 ... 0 ... 1 ... 4 ... 1.0 ... -1.0 ... 7.9 ... 7.9S ... 10.0 ... 10.0E ... 750 ... 750
360h ... 1 ... 7 ... 0 ... 1 ... 8 ... 2.1 ... -2.1 ... 10.2 ... 10.2S ... 7.8 ... 7.8E ... 760 ... 760
384h ... 1 ... 10 ... 0 ... 1 ... 11 ... 1.7 ... -1.7 ... 7.9 ... 7.9N ... 32.1 ... 32.1W ... 1940 ... 1940
408h ... 1 ... 7 ... 0 ... 1 ... 8 ... 2.0 ... -1.8 ... 10.3 ... 10.3N ... 28.3 ... 28.3W ... 1760 ... 1760
432h ... 0 ... 4 ... 1 ... 1 ... 5 ... 1.6 ... -1.2 ... 12.9 ... 12.9N ... 21.8 ... 21.8W ... 1490 ... 1490
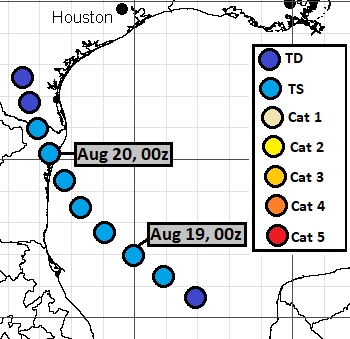
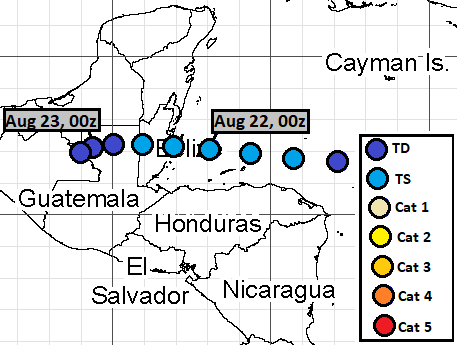
Here are the tracks once again.
This is from August 2, 18Z run:
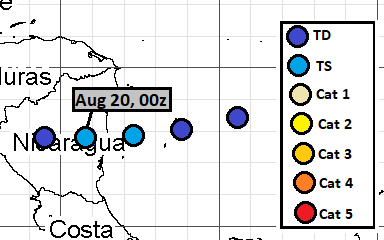
 This is from August 9, 12Z run:
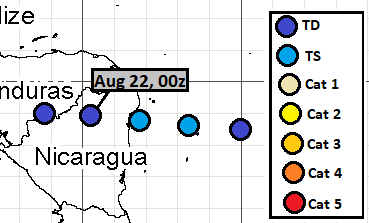
 This is from August 10, 00Z run:
 This is from August 10, 18Z run:
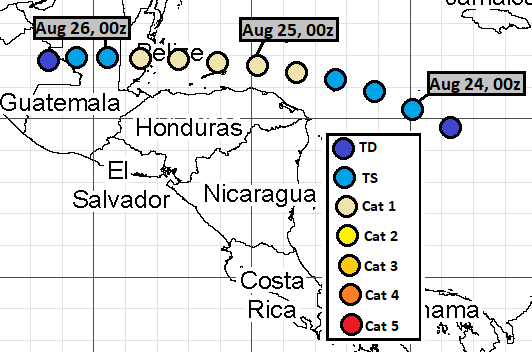 This is from August 15, 06Z run:
The runs, which I analysed but failed to generate a track were:
August 1, 18Z
August 2, 00Z
August 2, 06Z
August 2, 12Z
August 3, 00Z
August 3, 06Z
August 3, 12Z
I made five tracks about Hurricane Harvey. Additionally, there were seven runs, where I missed the system entirely. My predicted intensity was consistently way too low. In my tracks, Harvey progressed west pretty near the actual track of the hurricane, but differences in timing caused position errors to be enormous. I generally projected Harvey to be a short-lived cyclone in the West Caribbean. It is pretty comical, because in reality, Harvey had degenerated, and not yet regenerated, when in that region.
None of my tracks began before the first best track entry as TC at August 17, 18Z. None of my tracks continued after the last best track entry as TC at August 31, 00Z. Therefore, these times are the limits to my analysis.
Since I give only SSHS categories in my tracks, I don't calculate intensity errors in units of speed, but in categories. For this purpose, I define tropical storms as "Category 0", tropical depressions as "Category -1" and non-existence of a tropical cyclone as "Category -2".
I compare intensities only in cases, when either the best track data or my track has a tropical cyclone, or both. In other words, I leave the comparison out of calculations, if both best track data and my track lack a tropical cyclone.
In the five tracks, formation times ranged between August 18, 12Z and August 23, 18Z. Median was August 21, 06Z and average was August 20, 19Z.
The 12 peak intensities (those seven complete misses included) ranged between non-formation (Category -2) to Category 1. Median was Category -2 and average was Category -1.1.
Dissipation times ranged between August 20, 12Z and August 26, 18Z. Median was August 22, 12Z and average was August 22, 20Z.
The following lines will have the format:
lead time ... number of true detections ... number of misses ... number of false detections ... number of position comparisons ... number of intensity comparisons ... average error in intensity category ... bias in intensity category ... average error in latitude ... bias in latitude ... average error in longitude ... bias in longitude ... upper limit for scalar error in position (nautical miles)... calculated scalar bias in position (nautical miles)
168h ... 0 ... 1 ... 1 ... 1 ... 2 ... 2.0 ... 0.0 ... 1.4 ... 1.4S ... 0.3 ... 0.3W ... 90 ... 90
192h ... 0 ... 2 ... 1 ... 1 ... 3 ... 1.7 ... -1.0 ... 3.8 ... 3.8S ... 0.5 ... 0.5E ... 230 ... 230
216h ... 0 ... 4 ... 0 ... 0 ... 4 ... 1.8 ... -1.8 ... N/A ... N/A ... N/A ... N/A ... N/A ... N/A
240h ... 1 ... 1 ... 0 ... 1 ... 2 ... 2.5 ... -2.5 ... 0.7 ... 0.7S ... 14.2 ... 14.2W ... 830 ... 830
264h ... 0 ... 1 ... 0 ... 0 ... 1 ... 5.0 ... -5.0 ... N/A ... N/A ... N/A ... N/A ... N/A ... N/A
288h ... 0 ... 1 ... 1 ... 1 ... 2 ... 1.5 ... -0.5 ... 4.1 ... 4.1S ... 1.6 ... 1.6E ... 260 ... 260
312h ... 1 ... 1 ... 0 ... 1 ... 2 ... 1.0 ... -1.0 ... 6.7 ... 6.7S ... 13.6 ... 13.6E ... 890 ... 890
336h ... 1 ... 3 ... 0 ... 1 ... 4 ... 1.0 ... -1.0 ... 7.9 ... 7.9S ... 10.0 ... 10.0E ... 750 ... 750
360h ... 1 ... 7 ... 0 ... 1 ... 8 ... 2.1 ... -2.1 ... 10.2 ... 10.2S ... 7.8 ... 7.8E ... 760 ... 760
384h ... 1 ... 10 ... 0 ... 1 ... 11 ... 1.7 ... -1.7 ... 7.9 ... 7.9N ... 32.1 ... 32.1W ... 1940 ... 1940
408h ... 1 ... 7 ... 0 ... 1 ... 8 ... 2.0 ... -1.8 ... 10.3 ... 10.3N ... 28.3 ... 28.3W ... 1760 ... 1760
432h ... 0 ... 4 ... 1 ... 1 ... 5 ... 1.6 ... -1.2 ... 12.9 ... 12.9N ... 21.8 ... 21.8W ... 1490 ... 1490
Here are the tracks once again.
This is from August 2, 18Z run:
The runs, which I analysed but failed to generate a track were:
August 1, 18Z
August 2, 00Z
August 2, 06Z
August 2, 12Z
August 3, 00Z
August 3, 06Z
August 3, 12Z


Comments
Post a Comment