Verification of tracks made on Irma (2017) using GEFS mean fields
This is a repost from late 2017
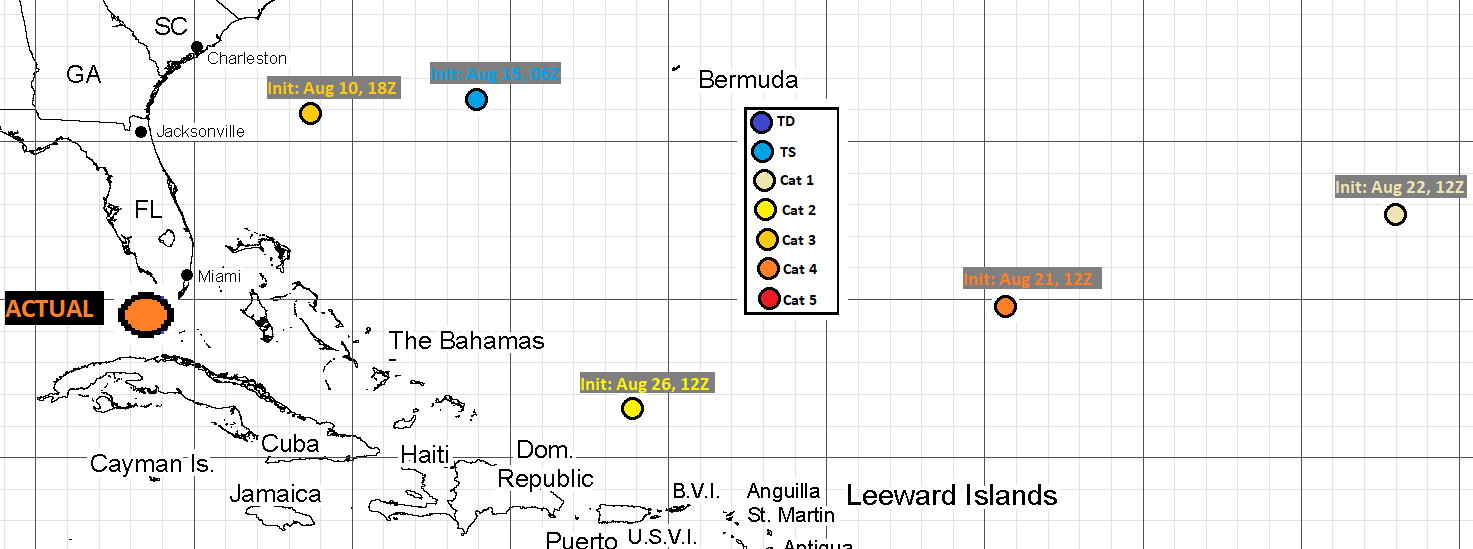
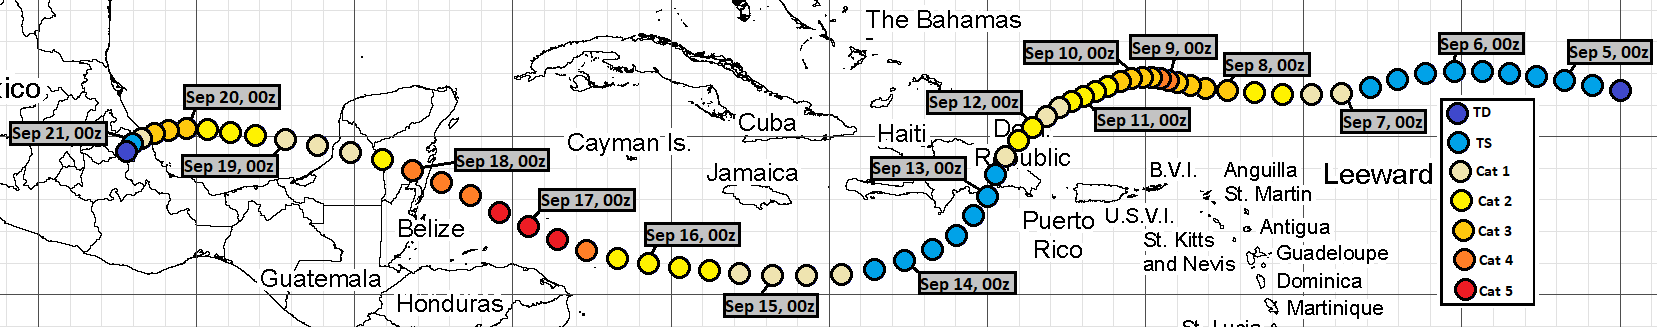
Above: my predictions for September 10, 12Z, compared to actual position.
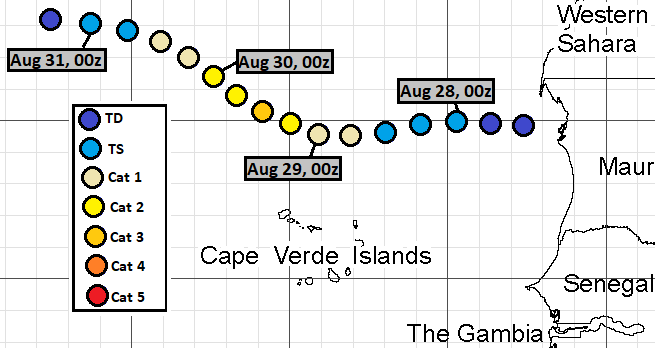
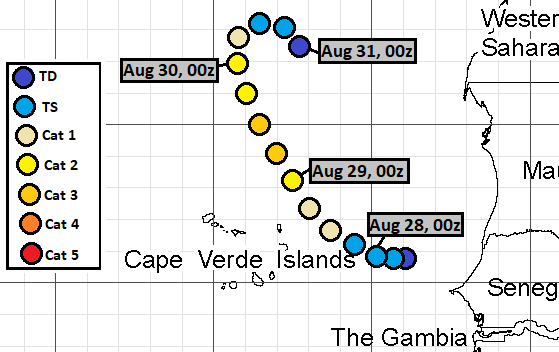
I made 10 tracks about Hurricane Irma. There were no cases, where I missed cyclogenesis. Intensity forecast was pretty good, generally much better than climatology. Position forecast was poor. Mostly I predicted cyclogenesis E of Cape Verde Islands, at excessively high latitudes, and almost immediately after the wave reached ocean. I predicted generally a NW motion into subtropics in Eastern Atlantic, possibly even followed by motion to the east towards Canary Islands.
My intensity analysis begins at August 25, 00Z, which is the earliest time, at which some of my tracks had cyclogenesis. Position analysis begins at first time with best track data, August 27, 18Z.
Position analysis ends at last time with best track data, September 12, 00Z. Intensity analysis ends at September 25, 12Z, after which none of my tracks continued.
Since I give only SSHS categories in my tracks, I don't calculate intensity errors in units of speed, but in categories. For this purpose, I define tropical storms as "Category 0", tropical depressions as "Category -1" and non-existence of a tropical cyclone as "Category -2".
I compare intensities only in cases, when either the best track data or my track has a tropical cyclone, or both. In other words, I leave the comparison out of calculations, if both best track data and my track lack a tropical cyclone.
In the 10 tracks, formation times ranged between August 25, 00Z and September 4, 12Z. Median was August 27, 21Z and average was August 28, 16Z.
The 10 peak intensities ranged between tropical storm (Category 0) and Category 5. Median was Category 3 and average was Category 2.9.
Dissipation times ranged between August 31, 00Z and September 25, 18Z. Median was September 9, 12Z and average was September 10, 17Z.
One track showed multiple degenerations and regenerations. In case of that track, the first cyclogenesis and final dissipation are used for statistics above.
The following lines will have the format:
date and time (UTC) yyyy/mm/dd/hh ... number of true detections ... number of misses ... number of false detections ... number of position comparisons ... number of intensity comparisons ... average error in intensity category ... bias in intensity category ... average error in latitude ... bias in latitude ... average error in longitude ... bias in longitude ... upper limit for scalar error in position (nautical miles)... calculated scalar bias in position (nautical miles)
Actual cyclogenesis:
2017/08/30/12 ... 8 ... 2 ... 0 ... 8 ... 10 ... 0.8 ... -0.8 ... 3.6 ... 2.8N ... 5.2 ... 1.5E ... 370 ... 190
Strengthening into major hurricane:
2017/09/01/00 ... 5 ... 5 ... 0 ... 6 ... 10 ... 3.8 ... -3.8 ... 2.3 ... 1.1N ... 6.5 ... 1.5E ... 400 ... 110
Strengthening into Cat 5:
2017/09/05/12 ... 4 ... 6 ... 0 ... 5 ... 10 ... 5.5 ... -5.5 ... 6.4 ... 6.4N ... 14.6 ... 12.7E ... 920 ... 830
Nearing the Florida Keys:
2017/19/10/12 ... 5 ... 5 ... 0 ... 5 ... 10 ... 4.0 ... -4.0 ... 3.9 ... 2.8N ... 19.5 ... 19.5E ... 1080 ... 1080
And for lead times:
168h ... 1 ... 2 ... 3 ... 4 ... 6 ... 2.3 ... 0.0 ... 3.2 ... 3.2N ... 1.8 ... 1.8E ... 220 ... 220
192h ... 2 ... 3 ... 2 ... 4 ... 7 ... 2.1 ... -1.3 ... 3.2 ... 3.2N ... 4.5 ... 4.2E ... 320 ... 310
216h ... 5 ... 3 ... 0 ... 5 ... 8 ... 2.5 ... -2.5 ... 4.2 ... 4.2N ... 5.3 ... 5.3E ... 400 ... 400
240h ... 5 ... 3 ... 1 ... 5 ... 9 ... 3.1 ... -2.7 ... 3.4 ... 3.4N ... 6.4 ... 6.4E ... 420 ... 420
264h ... 5 ... 3 ... 0 ... 5 ... 8 ... 3.5 ... -3.5 ... 4.1 ... 3.8N ... 9.1 ... 9.1E ... 580 ... 580
288h ... 5 ... 3 ... 0 ... 5 ... 8 ... 3.6 ... -3.6 ... 5.1 ... 5.1N ... 12.4 ... 12.4E ... 780 ... 780
312h ... 4 ... 4 ... 0 ... 5 ... 8 ... 4.0 ... -4.0 ... 4.2 ... 4.2N ... 15.0 ... 10.6E ... 910 ... 670
336h ... 4 ... 4 ... 0 ... 5 ... 8 ... 4.8 ... -4.8 ... 5.1 ... 4.4N ... 18.5 ... 14.1E ... 1120 ... 860
360h ... 4 ... 4 ... 2 ... 5 ... 10 ... 4.7 ... -4.3 ... 6.3 ... 4.0N ... 21.6 ... 18.1E ... 1310 ... 1080
384h ... 5 ... 4 ... 1 ... 5 ... 10 ... 4.9 ... -4.1 ... 6.3 ... 1.8N ... 24.8 ... 21.6E ... 1490 ... 1260
408h ... 3 ... 6 ... 2 ... 4 ... 10 ... 5.1 ... -4.1 ... 4.7 ... 2.9N ... 29.3 ... 11.1E ... 1160 ... 670
432h ... 2 ... 6 ... 2 ... 4 ... 10 ... 4.4 ... -3.6 ... 4.4 ... 2.2N ... 20.1 ... 13.0E ... 1200 ... 770
456h ... 2 ... 5 ... 2 ... 4 ... 9 ... 3.4 ... -2.3 ... 2.6 ... 0.1S ... 20.3 ... 13.8E ... 1190 ... 800
480h ... 3 ... 3 ... 1 ... 4 ... 7 ... 2.9 ... -0.9 ... 1.1 ... 0.1N ... 19.4 ... 14.2E ... 1130 ... 820
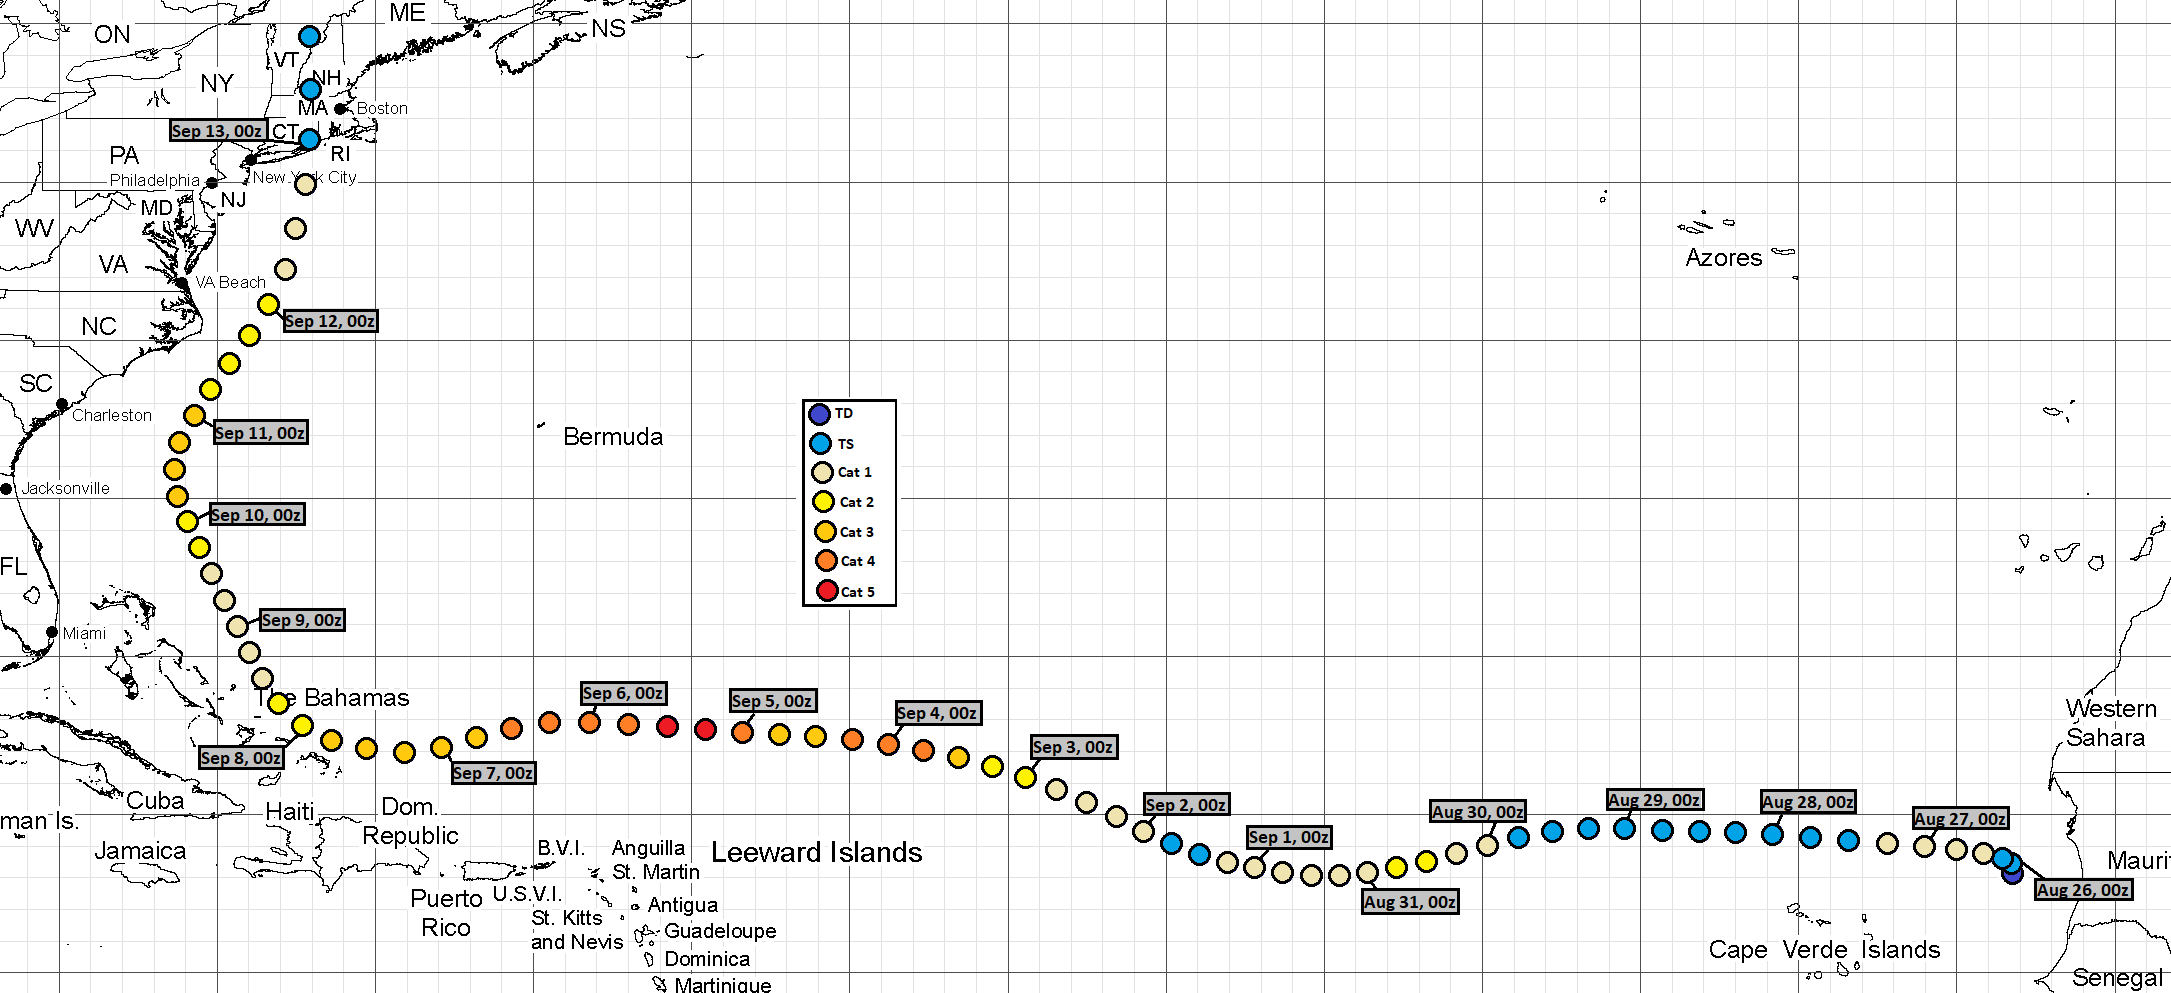
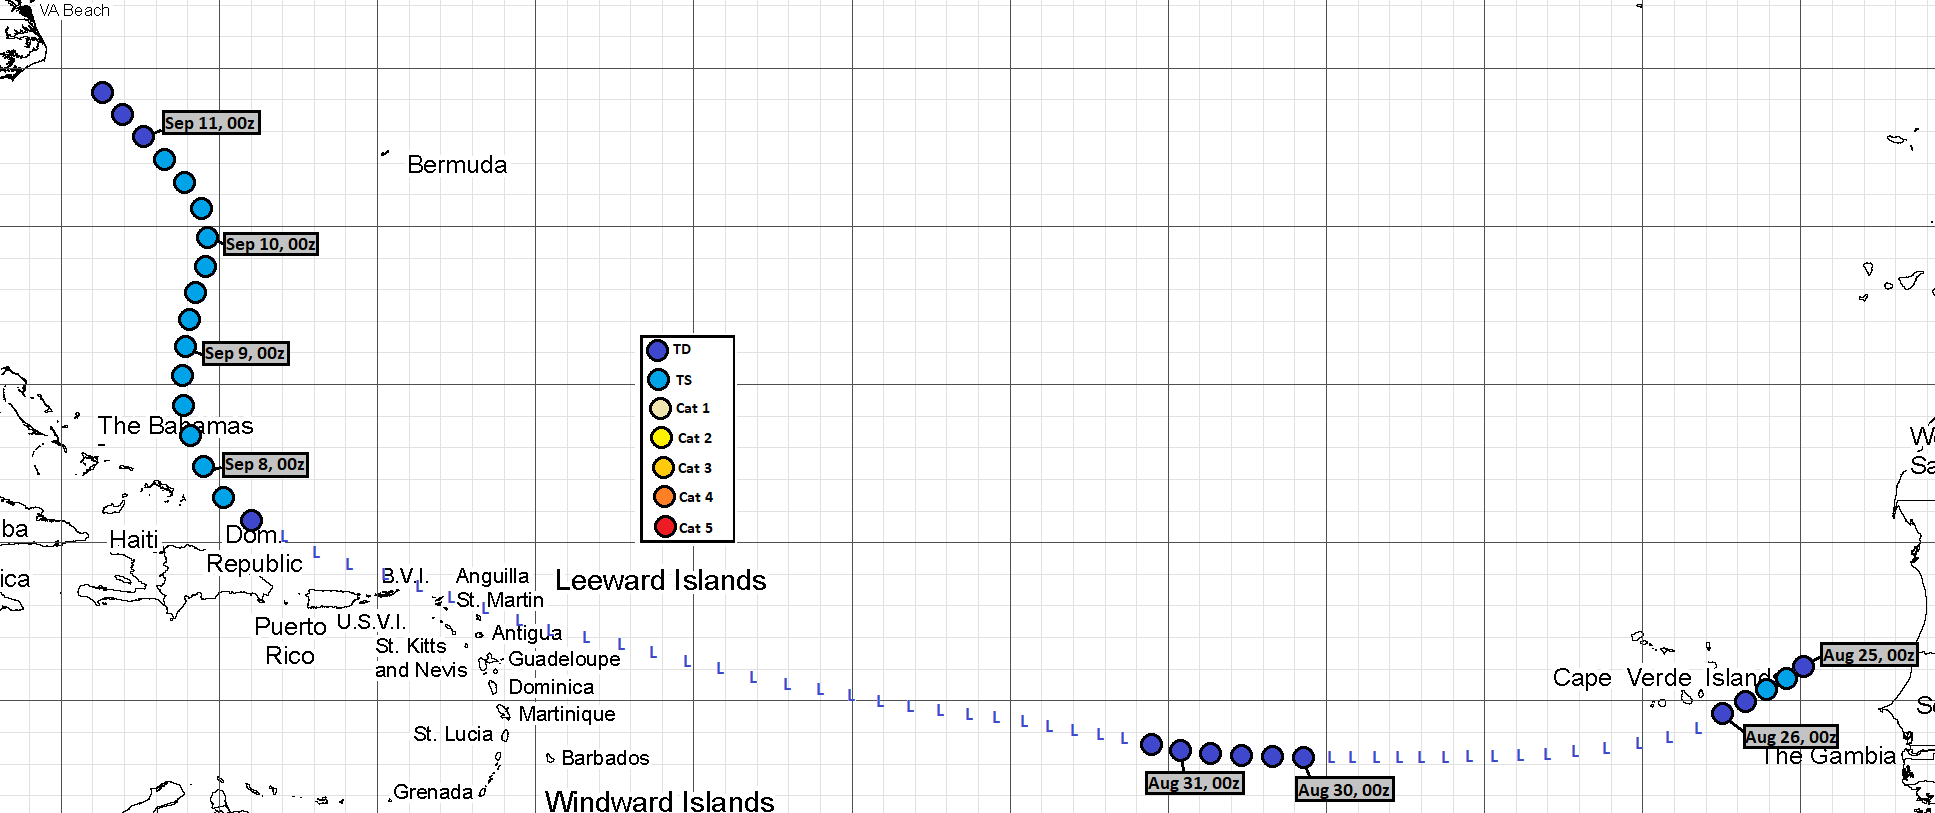
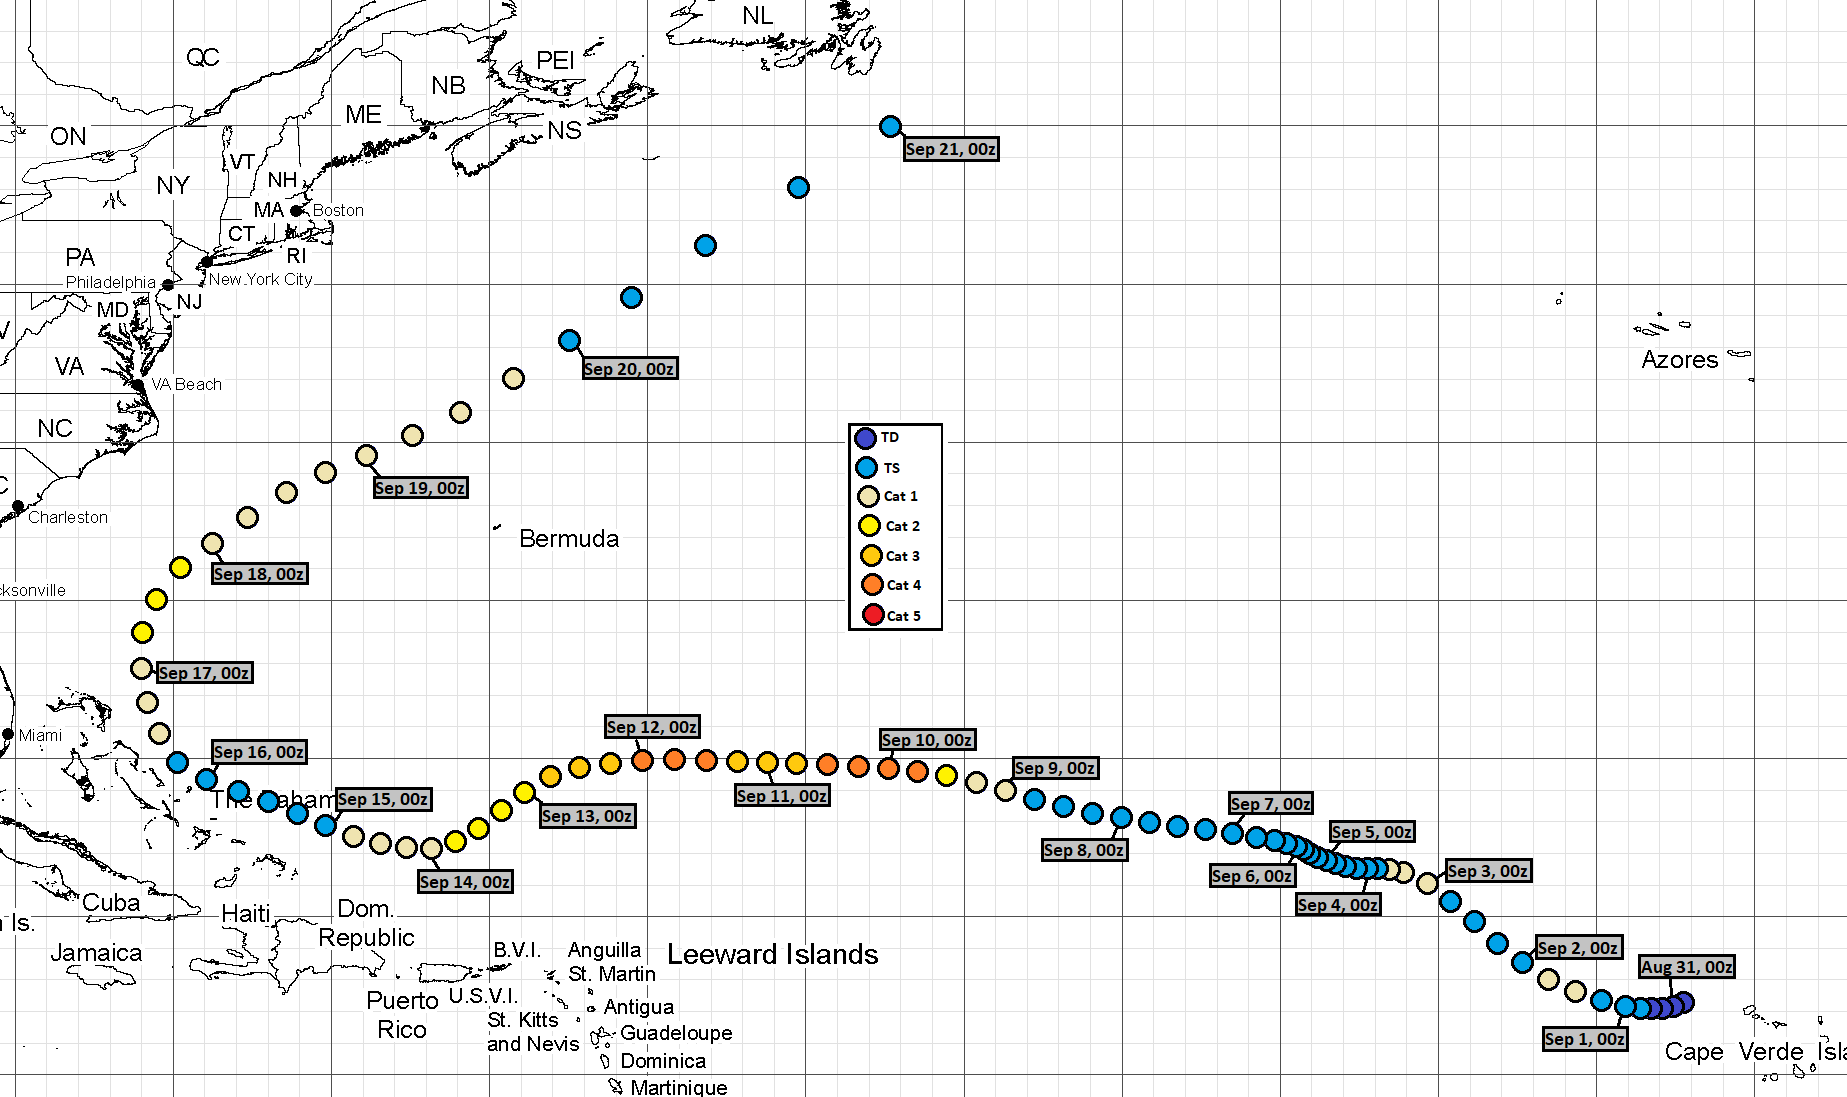
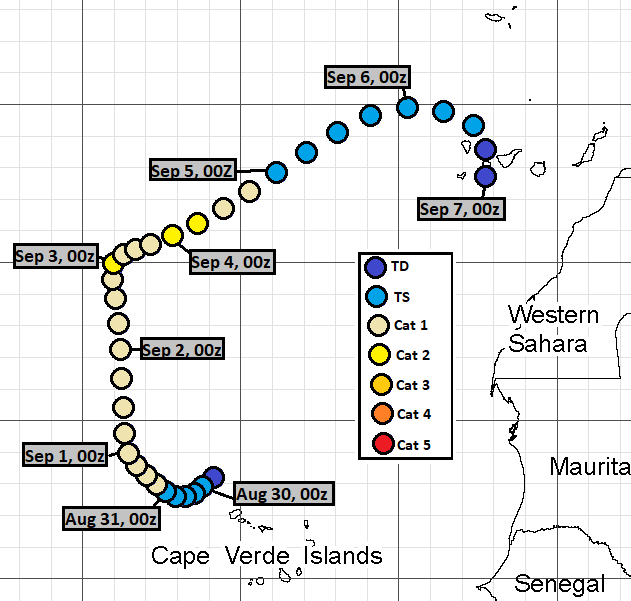
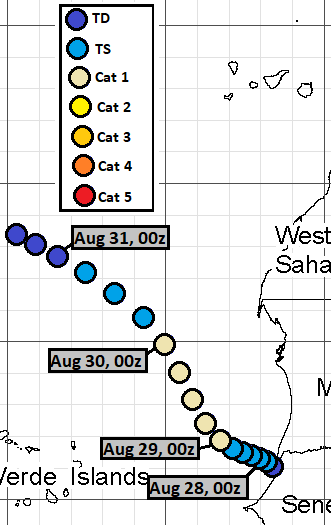
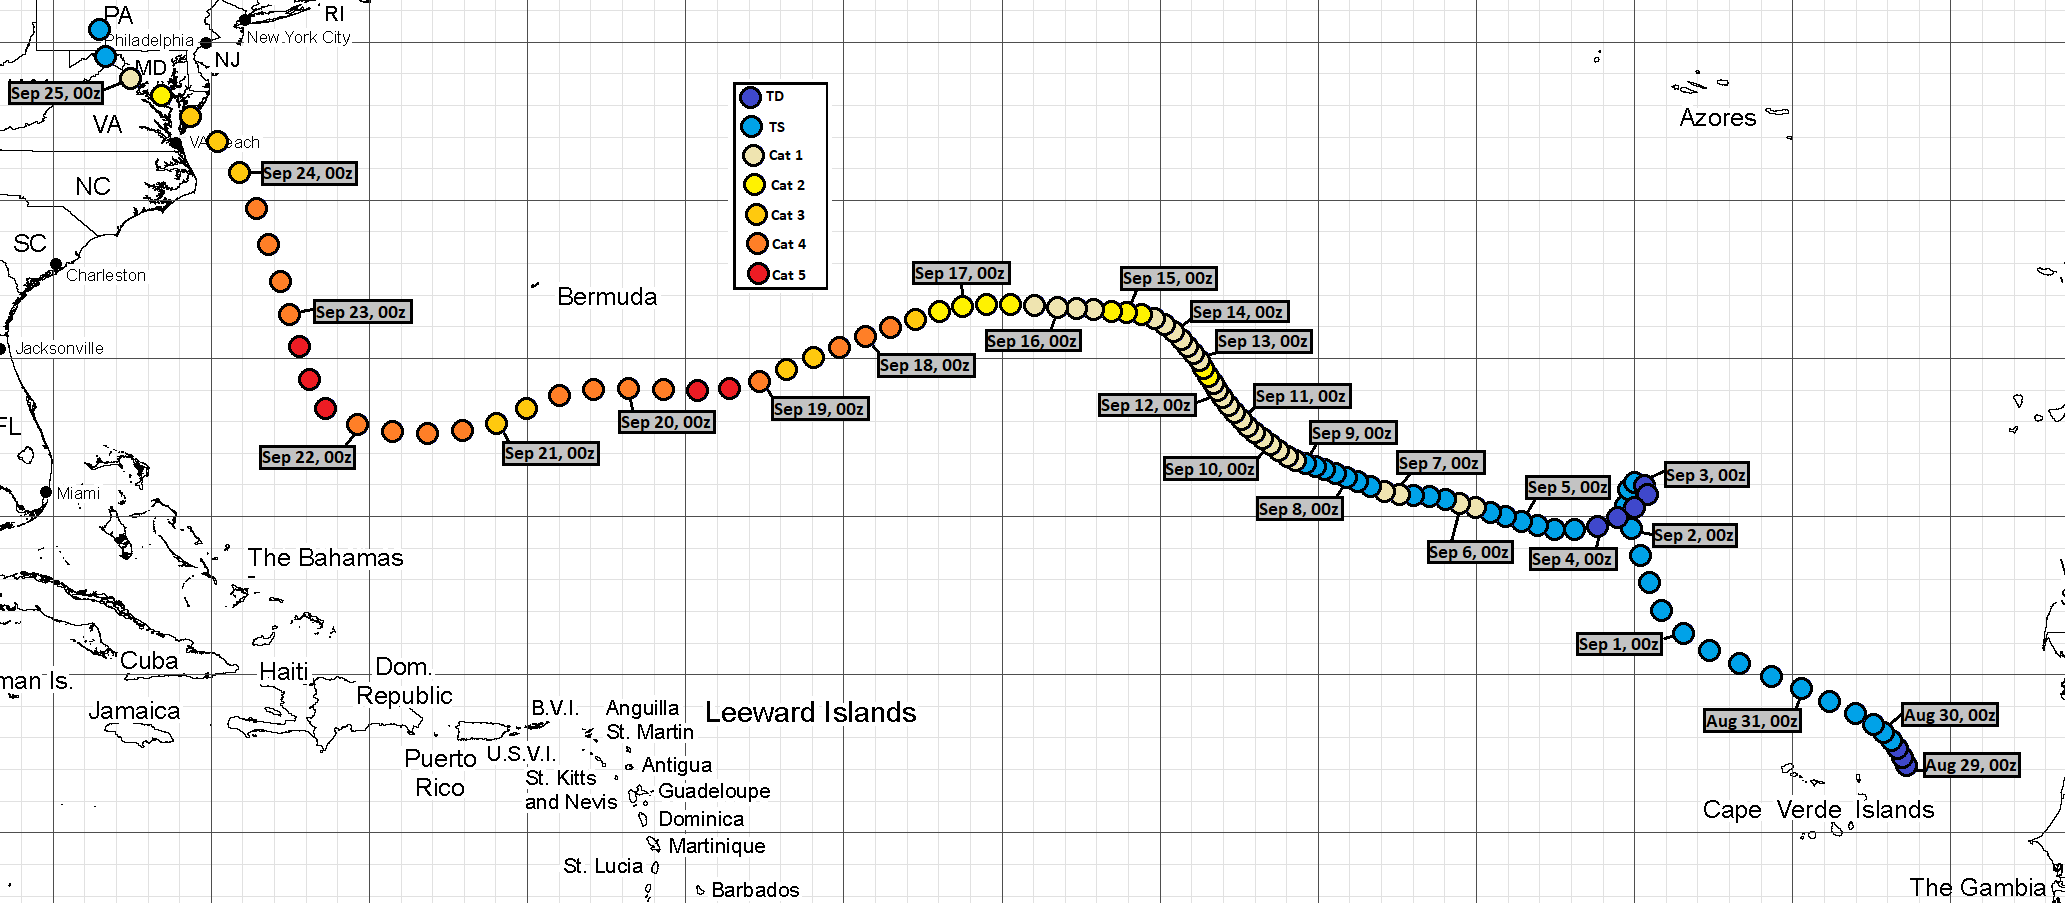
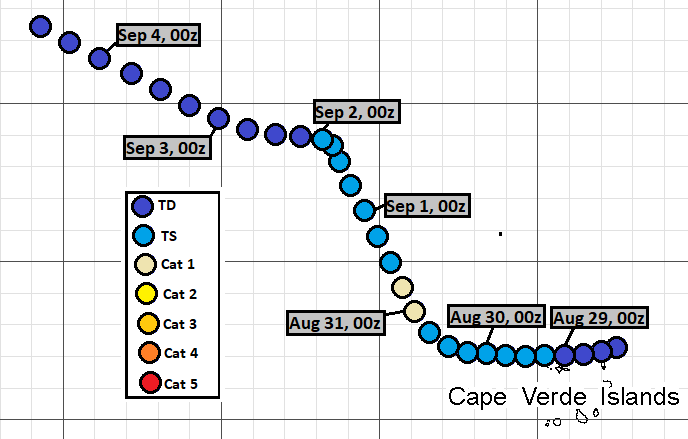
Here are the tracks once again.
August 10, 18Z run:


Comments
Post a Comment