Verification of tracks made on Jose (2017) using GEFS mean fields
This is a repost from early 2018
I made four tracks about Hurricane Jose. Additionally, there were six runs, where I missed the system entirely. My predicted intensity was generally too low. The longevity of Jose was completely missed.
None of my tracks began before the first best track entry as TC at September 5, 12Z. None of my tracks continued after the last best track entry as TC at September 21, 18Z. Therefore, these times are the limits to my analysis.
Since I give only SSHS categories in my tracks, I don't calculate intensity errors in units of speed, but in categories. For this purpose, I define tropical storms as "Category 0", tropical depressions as "Category -1" and non-existence of a tropical cyclone as "Category -2".
I compare intensities only in cases, when either the best track data or my track has a tropical cyclone, or both. In other words, I leave the comparison out of calculations, if both best track data and my track lack a tropical cyclone.
In the four tracks, formation times ranged between September 6, 00Z and September 9, 12Z. Median was September 6, 15Z and average was September 7, 05Z.
The 10 peak intensities (those six complete misses included) ranged between non-formation (Category -2) to Category 4. Median was Category -2 and average was Category -0.8.
Dissipation times ranged between September 7, 12Z and September 18, 12Z. Median was September 11, 00Z and average was September 12, 00Z.
The following lines will have the format:
lead time ... number of true detections ... number of misses ... number of false detections ... number of position comparisons ... number of intensity comparisons ... average error in intensity category ... bias in intensity category ... average error in latitude ... bias in latitude ... average error in longitude ... bias in longitude ... upper limit for scalar error in position (nautical miles)... calculated scalar bias in position (nautical miles)
168h ... 1 ... 2 ... 0 ... 1 ... 3 ... 5.0 ... -5.0 ... 3.5 ... 3.5S ... 2.3 ... 2.3E ... 250 ... 250
192h ... 1 ... 2 ... 0 ... 1 ... 3 ... 4.3 ... -4.3 ... 4.3 ... 4.3S ... 5.2 ... 5.2E ... 390 ... 390
216h ... 1 ... 2 ... 0 ... 1 ... 3 ... 3.7 ... -3.7 ... 4.5 ... 4.5S ... 5.5 ... 5.5E ... 410 ... 410
240h ... 1 ... 3 ... 0 ... 1 ... 4 ... 2.5 ... -2.5 ... 1.6 ... 1.6S ... 3.9 ... 3.9E ... 230 ... 230
264h ... 1 ... 3 ... 0 ... 1 ... 4 ... 2.5 ... -2.5 ... 1.8 ... 1.8N ... 5.9 ... 5.9E ... 340 ... 340
288h ... 0 ... 4 ... 0 ... 0 ... 4 ... 2.8 ... -2.8 ... N/A ... N/A ... N/A ... N/A ... N/A ... N/A
312h ... 0 ... 5 ... 0 ... 0 ... 5 ... 3.2 ... -3.2 ... N/A ... N/A ... N/A ... N/A ... N/A ... N/A
336h ... 1 ... 6 ... 0 ... 1 ... 7 ... 2.7 ... -2.7 ... 8.2 ... 8.2S ... 7.9 ... 7.9E ... 680 ... 680
360h ... 1 ... 9 ... 0 ... 1 ... 10 ... 2.7 ... -2.7 ... 10.5 ... 10.5S ... 8.5 ... 8.5E ... 810 ... 810
384h ... 1 ... 9 ... 0 ... 1 ... 10 ... 3.1 ... -3.1 ... 12.9 ... 12.9S ... 8.3 ... 8.3E ... 920 ... 920
408h ... 1 ... 9 ... 0 ... 1 ... 10 ... 4.1 ... -3.7 ... 15.5 ... 15.5S ... 3.6 ... 3.6E ... 960 ... 960
432h ... 1 ... 9 ... 0 ... 1 ... 10 ... 4.6 ... -4.0 ... 14.7 ... 14.7S ... 2.3 ... 2.3W ... 900 ... 900
456h ... 1 ... 8 ... 0 ... 1 ... 9 ... 4.1 ... -4.1 ... 13.8 ... 13.8S ... 5.0 ... 5.0W ... 880 ... 880
480h ... 1 ... 7 ... 0 ... 1 ... 8 ... 3.1 ... -3.1 ... 14.5 ... 14.5S ... 5.4 ... 5.4W ... 930 ... 930
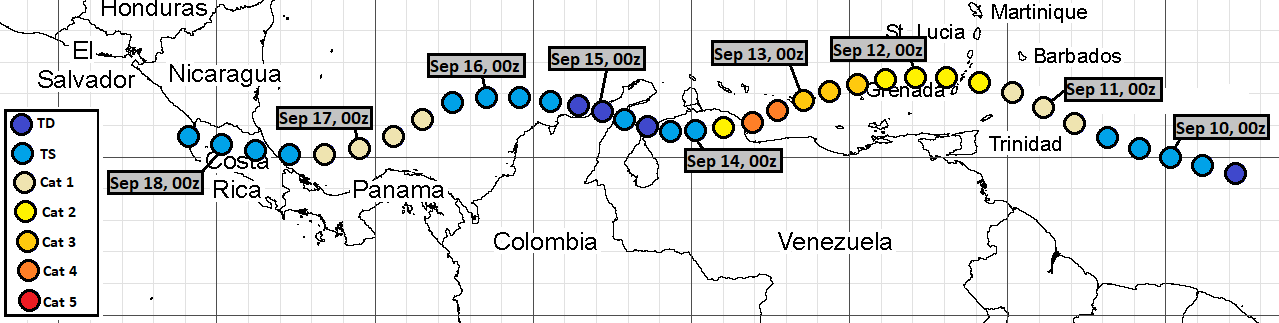
Here are the tracks once again:
August 26, 12Z run:
 September 1, 06Z run:
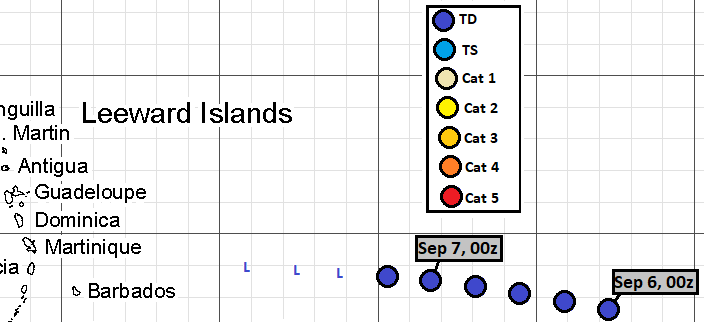 September 2, 06Z run:
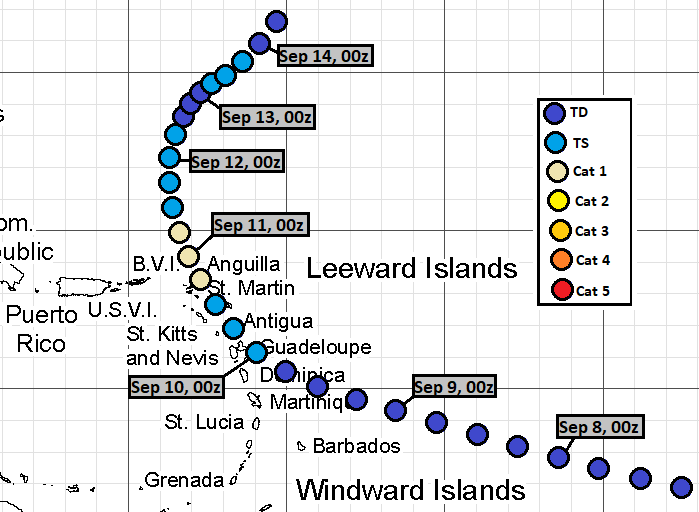
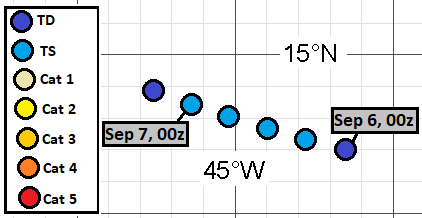 September 3, 06Z run:
The runs that I analysed, but failed to detect the system were:
August 21, 12Z
August 21, 18Z
August 22, 06Z
August 22, 12Z
August 23, 06Z
August 23, 12Z
I made four tracks about Hurricane Jose. Additionally, there were six runs, where I missed the system entirely. My predicted intensity was generally too low. The longevity of Jose was completely missed.
None of my tracks began before the first best track entry as TC at September 5, 12Z. None of my tracks continued after the last best track entry as TC at September 21, 18Z. Therefore, these times are the limits to my analysis.
Since I give only SSHS categories in my tracks, I don't calculate intensity errors in units of speed, but in categories. For this purpose, I define tropical storms as "Category 0", tropical depressions as "Category -1" and non-existence of a tropical cyclone as "Category -2".
I compare intensities only in cases, when either the best track data or my track has a tropical cyclone, or both. In other words, I leave the comparison out of calculations, if both best track data and my track lack a tropical cyclone.
In the four tracks, formation times ranged between September 6, 00Z and September 9, 12Z. Median was September 6, 15Z and average was September 7, 05Z.
The 10 peak intensities (those six complete misses included) ranged between non-formation (Category -2) to Category 4. Median was Category -2 and average was Category -0.8.
Dissipation times ranged between September 7, 12Z and September 18, 12Z. Median was September 11, 00Z and average was September 12, 00Z.
The following lines will have the format:
lead time ... number of true detections ... number of misses ... number of false detections ... number of position comparisons ... number of intensity comparisons ... average error in intensity category ... bias in intensity category ... average error in latitude ... bias in latitude ... average error in longitude ... bias in longitude ... upper limit for scalar error in position (nautical miles)... calculated scalar bias in position (nautical miles)
168h ... 1 ... 2 ... 0 ... 1 ... 3 ... 5.0 ... -5.0 ... 3.5 ... 3.5S ... 2.3 ... 2.3E ... 250 ... 250
192h ... 1 ... 2 ... 0 ... 1 ... 3 ... 4.3 ... -4.3 ... 4.3 ... 4.3S ... 5.2 ... 5.2E ... 390 ... 390
216h ... 1 ... 2 ... 0 ... 1 ... 3 ... 3.7 ... -3.7 ... 4.5 ... 4.5S ... 5.5 ... 5.5E ... 410 ... 410
240h ... 1 ... 3 ... 0 ... 1 ... 4 ... 2.5 ... -2.5 ... 1.6 ... 1.6S ... 3.9 ... 3.9E ... 230 ... 230
264h ... 1 ... 3 ... 0 ... 1 ... 4 ... 2.5 ... -2.5 ... 1.8 ... 1.8N ... 5.9 ... 5.9E ... 340 ... 340
288h ... 0 ... 4 ... 0 ... 0 ... 4 ... 2.8 ... -2.8 ... N/A ... N/A ... N/A ... N/A ... N/A ... N/A
312h ... 0 ... 5 ... 0 ... 0 ... 5 ... 3.2 ... -3.2 ... N/A ... N/A ... N/A ... N/A ... N/A ... N/A
336h ... 1 ... 6 ... 0 ... 1 ... 7 ... 2.7 ... -2.7 ... 8.2 ... 8.2S ... 7.9 ... 7.9E ... 680 ... 680
360h ... 1 ... 9 ... 0 ... 1 ... 10 ... 2.7 ... -2.7 ... 10.5 ... 10.5S ... 8.5 ... 8.5E ... 810 ... 810
384h ... 1 ... 9 ... 0 ... 1 ... 10 ... 3.1 ... -3.1 ... 12.9 ... 12.9S ... 8.3 ... 8.3E ... 920 ... 920
408h ... 1 ... 9 ... 0 ... 1 ... 10 ... 4.1 ... -3.7 ... 15.5 ... 15.5S ... 3.6 ... 3.6E ... 960 ... 960
432h ... 1 ... 9 ... 0 ... 1 ... 10 ... 4.6 ... -4.0 ... 14.7 ... 14.7S ... 2.3 ... 2.3W ... 900 ... 900
456h ... 1 ... 8 ... 0 ... 1 ... 9 ... 4.1 ... -4.1 ... 13.8 ... 13.8S ... 5.0 ... 5.0W ... 880 ... 880
480h ... 1 ... 7 ... 0 ... 1 ... 8 ... 3.1 ... -3.1 ... 14.5 ... 14.5S ... 5.4 ... 5.4W ... 930 ... 930
Here are the tracks once again:
August 26, 12Z run:
The runs that I analysed, but failed to detect the system were:
August 21, 12Z
August 21, 18Z
August 22, 06Z
August 22, 12Z
August 23, 06Z
August 23, 12Z


Comments
Post a Comment