Verification of tracks made of Amanda
I made 26 tracks of Tropical Storm Amanda, before it was assessed as
a tropical cyclone. I made two more tracks after that point.
Additionally, within 480 hours of cyclogenesis, there were 22 instances,
when I missed cyclogenesis entirely. Originally the movement was projected to be to the west, resulting often in very large position errors.
For position errors, Cristobal is considered to be the remnants of Amanda. However, since Cristobal is in the wrong basin, it is not considered a TC (regenerated Amanda), when calculating hits, false detections and misses.
As of this analysis, best track positions are available May 28, 18Z thru June 8, 12Z, and as such, position comparisons are possible only for this timespan. Any further additions to the best track of Cristobal won't affect these calculations.
Since I give only SSHS categories in my tracks, I don't calculate intensity errors in units of speed, but in categories. For this purpose, I define tropical or subtropical storms as "Category 0", tropical or subtropical depressions as "Category -1" and non-existence of a tropical or subtropical cyclone as "Category -2".
In the 26 tracks (made before operationally recognized cyclogenesis), formation times ranged between May 28, 12Z and June 4, 06Z. Average was May 31, 02Z and median was May 30, 06Z.
In the 49 cases (27 tracks, before the tracks and data agreed, that tropical storm would remain the peak intensity, and 22 complete misses), peak intensity ranged between Category -2 and Category 5. Average was Category -0.06 and median was Category 0.
In the 28 tracks (made before operationally recognized degeneration into remnant low), dissipation times ranged between May 31, 12Z and June 12, 18Z. Average was June 4, 03Z and median was June 1, 21Z.
At the lead time of 1 day (24 hours), there were 2 hits, 2 false detections and 0 misses. 4 available position comparisons produce an average error of 64 nautical miles.
At the lead time of 2 days (48 hours), there were 2 hits, 2 false detections and 0 misses. 4 available position comparisons produce an average error of 108 nautical miles.
At the lead time of 3 days (72 hours), there were 2 hits, 5 false detections and 0 misses. 7 available position comparisons produce an average error of 130 nautical miles.
At the lead time of 4 days (96 hours), there were 1 hit, 6 false detections and 0 misses. 7 available position comparisons produce an average error of 134 nautical miles.
At the lead time of 5 days (120 hours), there were 3 hits, 2 false detections and 0 misses. 5 available position comparisons produce an average error of 78 nautical miles.
At the lead time of 6 days (144 hours), there were 2 hits, 3 false detections and 0 misses. 5 available position comparisons produce an average error of 94 nautical miles.
At the lead time of 7 days (168 hours), there were 2 hits, 1 false detection and 0 misses. 3 available position comparisons produce an average error of 150 nautical miles.
At the lead time of 8 days (192 hours), there were 0 hits, 2 false detections and 1 miss. 2 available position comparisons produce an average error of 224 nautical miles.
At the lead time of 9 days (216 hours), there were 0 hits, 0 false detections and 2 misses. No available position comparisons.
At the lead time of 10 days (240 hours), there were 0 hits, 0 false detections and 3 misses. No available position comparisons.
At the lead time of 11 days (264 hours), there were 0 hits, 0 false detections and 2 misses. No available position comparisons.
At the lead time of 12 days (288 hours), there were 0 hits, 1 false detection and 2 misses. 1 available position comparison produces an average error of 429 nautical miles.
At the lead time of 13 days (312 hours), there were 0 hits, 2 false detections and 3 misses. 2 available position comparisons produce an average error of 429 nautical miles.
At the lead time of 14 days (336 hours), there were 0 hits, 3 false detections and 3 misses. 3 available position comparisons produce an average error of 295 nautical miles.
At the lead time of 15 days (360 hours), there were 1 hit, 2 false detections and 2 misses. 3 available position comparisons produce an average error of 305 nautical miles.
At the lead time of 16 days (384 hours), there were 0 hits, 2 false detections and 3 misses. 2 available position comparisons produce an average error of 413 nautical miles.
At the lead time of 17 days (408 hours), there were 1 hit, 8 false detections and 2 misses. 9 available position comparisons produce an average error of 637 nautical miles.
At the lead time of 18 days (432 hours), there were 0 hits, 10 false detections and 3 misses. 10 available position comparisons produce an average error of 762 nautical miles.
At the lead time of 19 days (456 hours), there were 0 hits, 9 false detections and 3 misses. 9 available position comparisons produce an average error of 860 nautical miles.
At the lead time of 20 days (480 hours), there were 0 hits, 8 false detections and 3 misses. 8 available position comparisons produce an average error of 943 nautical miles.
Circle coloration scheme

Here are the tracks once again.
May 14, 06Z:

May 14, 12Z:
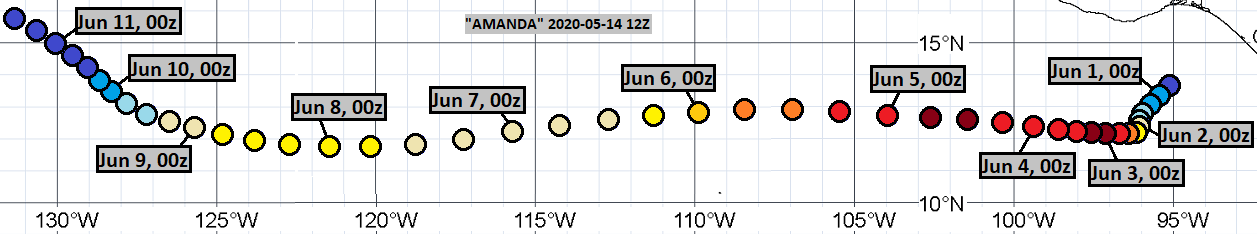
May 15, 06Z:
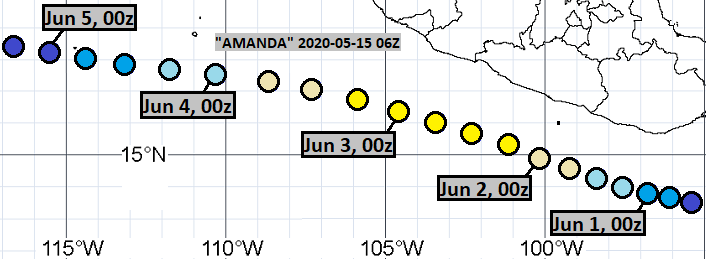
May 15, 12Z:
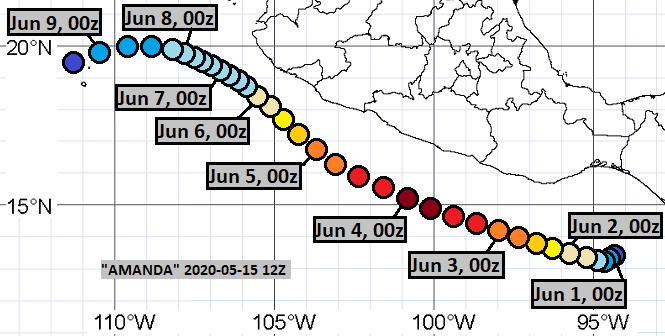
May 16, 12Z:
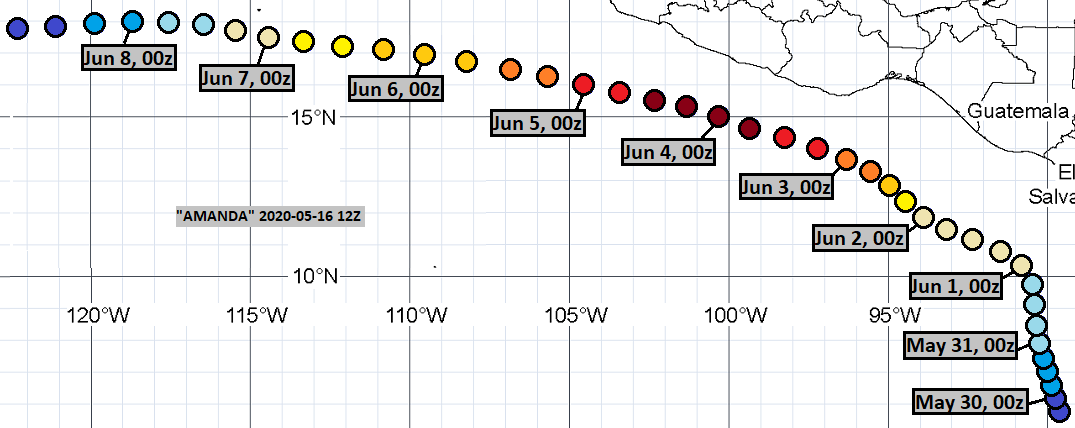
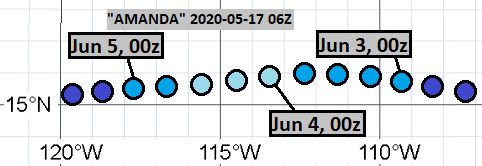
May 17, 06Z:
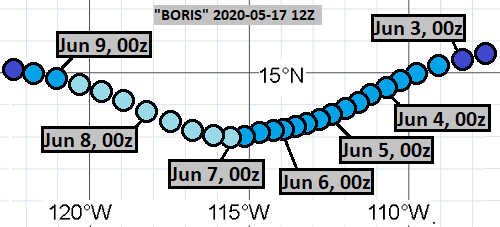
May 17, 12Z:
May 17, 18Z:

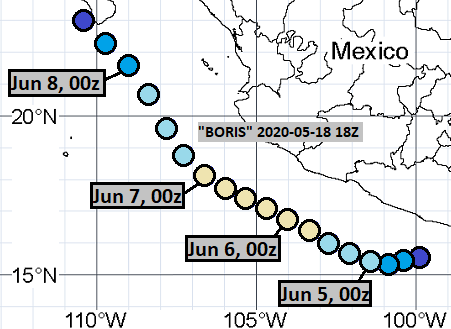
May 18, 18Z:
May 19, 06Z:

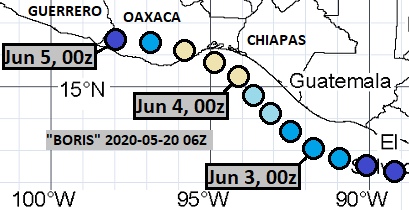
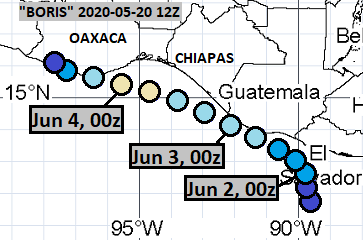
May 20, 06Z:
May 20, 12Z:
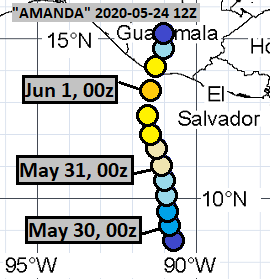
May 24, 06Z:

May 24, 12Z:
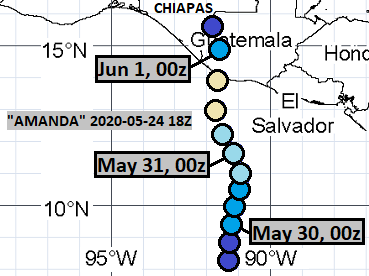
May 24, 18Z:
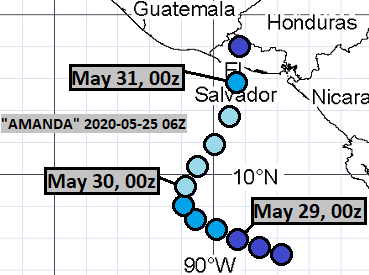
May 25, 06Z:
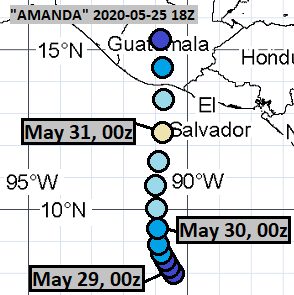
May 25, 18Z:
May 26, 06Z:

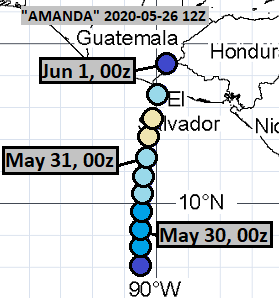
May 26, 12Z:
May 27, 12Z:
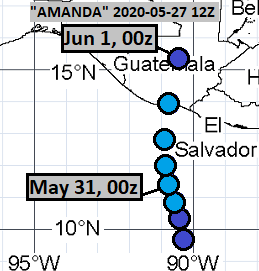
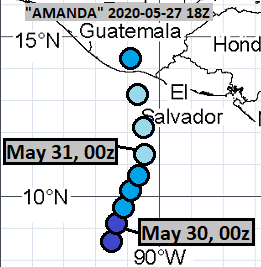
May 27, 18Z:
May 28, 12Z:

May 28, 18Z:
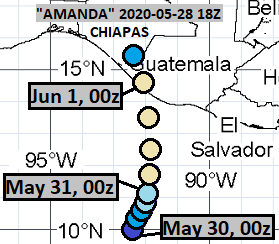
May 29, 12Z:

May 29, 18Z:

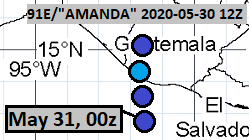
May 30, 12Z:
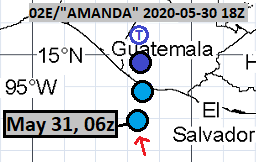
May 30, 18Z:
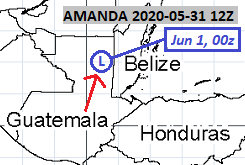
May 31, 12Z:
The complete misses were from the following model cycles:
May 10, 18Z
May 11, 06Z
May 11, 12Z
May 11, 18Z
May 12, 06Z
May 12, 12Z
May 12, 18Z
May 13, 06Z
May 13, 12Z
May 13, 18Z
May 14, 18Z
May 15, 18Z
May 16, 06Z
May 16, 18Z
May 18, 06Z
May 18, 12Z
May 20, 18Z
May 21, 06Z
May 21, 12Z
May 21, 18Z
May 22, 06Z
May 23, 06Z
For position errors, Cristobal is considered to be the remnants of Amanda. However, since Cristobal is in the wrong basin, it is not considered a TC (regenerated Amanda), when calculating hits, false detections and misses.
As of this analysis, best track positions are available May 28, 18Z thru June 8, 12Z, and as such, position comparisons are possible only for this timespan. Any further additions to the best track of Cristobal won't affect these calculations.
Since I give only SSHS categories in my tracks, I don't calculate intensity errors in units of speed, but in categories. For this purpose, I define tropical or subtropical storms as "Category 0", tropical or subtropical depressions as "Category -1" and non-existence of a tropical or subtropical cyclone as "Category -2".
In the 26 tracks (made before operationally recognized cyclogenesis), formation times ranged between May 28, 12Z and June 4, 06Z. Average was May 31, 02Z and median was May 30, 06Z.
In the 49 cases (27 tracks, before the tracks and data agreed, that tropical storm would remain the peak intensity, and 22 complete misses), peak intensity ranged between Category -2 and Category 5. Average was Category -0.06 and median was Category 0.
In the 28 tracks (made before operationally recognized degeneration into remnant low), dissipation times ranged between May 31, 12Z and June 12, 18Z. Average was June 4, 03Z and median was June 1, 21Z.
At the lead time of 1 day (24 hours), there were 2 hits, 2 false detections and 0 misses. 4 available position comparisons produce an average error of 64 nautical miles.
At the lead time of 2 days (48 hours), there were 2 hits, 2 false detections and 0 misses. 4 available position comparisons produce an average error of 108 nautical miles.
At the lead time of 3 days (72 hours), there were 2 hits, 5 false detections and 0 misses. 7 available position comparisons produce an average error of 130 nautical miles.
At the lead time of 4 days (96 hours), there were 1 hit, 6 false detections and 0 misses. 7 available position comparisons produce an average error of 134 nautical miles.
At the lead time of 5 days (120 hours), there were 3 hits, 2 false detections and 0 misses. 5 available position comparisons produce an average error of 78 nautical miles.
At the lead time of 6 days (144 hours), there were 2 hits, 3 false detections and 0 misses. 5 available position comparisons produce an average error of 94 nautical miles.
At the lead time of 7 days (168 hours), there were 2 hits, 1 false detection and 0 misses. 3 available position comparisons produce an average error of 150 nautical miles.
At the lead time of 8 days (192 hours), there were 0 hits, 2 false detections and 1 miss. 2 available position comparisons produce an average error of 224 nautical miles.
At the lead time of 9 days (216 hours), there were 0 hits, 0 false detections and 2 misses. No available position comparisons.
At the lead time of 10 days (240 hours), there were 0 hits, 0 false detections and 3 misses. No available position comparisons.
At the lead time of 11 days (264 hours), there were 0 hits, 0 false detections and 2 misses. No available position comparisons.
At the lead time of 12 days (288 hours), there were 0 hits, 1 false detection and 2 misses. 1 available position comparison produces an average error of 429 nautical miles.
At the lead time of 13 days (312 hours), there were 0 hits, 2 false detections and 3 misses. 2 available position comparisons produce an average error of 429 nautical miles.
At the lead time of 14 days (336 hours), there were 0 hits, 3 false detections and 3 misses. 3 available position comparisons produce an average error of 295 nautical miles.
At the lead time of 15 days (360 hours), there were 1 hit, 2 false detections and 2 misses. 3 available position comparisons produce an average error of 305 nautical miles.
At the lead time of 16 days (384 hours), there were 0 hits, 2 false detections and 3 misses. 2 available position comparisons produce an average error of 413 nautical miles.
At the lead time of 17 days (408 hours), there were 1 hit, 8 false detections and 2 misses. 9 available position comparisons produce an average error of 637 nautical miles.
At the lead time of 18 days (432 hours), there were 0 hits, 10 false detections and 3 misses. 10 available position comparisons produce an average error of 762 nautical miles.
At the lead time of 19 days (456 hours), there were 0 hits, 9 false detections and 3 misses. 9 available position comparisons produce an average error of 860 nautical miles.
At the lead time of 20 days (480 hours), there were 0 hits, 8 false detections and 3 misses. 8 available position comparisons produce an average error of 943 nautical miles.
Circle coloration scheme
Here are the tracks once again.
May 14, 06Z:
May 14, 12Z:
May 15, 06Z:
May 15, 12Z:
May 16, 12Z:
May 17, 06Z:
May 17, 12Z:
May 17, 18Z:
May 18, 18Z:
May 19, 06Z:
May 20, 06Z:
May 20, 12Z:
May 24, 06Z:
May 24, 12Z:
May 24, 18Z:
May 25, 06Z:
May 25, 18Z:
May 26, 06Z:
May 26, 12Z:
May 27, 12Z:
May 27, 18Z:
May 28, 12Z:
May 28, 18Z:
May 29, 12Z:
May 29, 18Z:
May 30, 12Z:
May 30, 18Z:
May 31, 12Z:
The complete misses were from the following model cycles:
May 10, 18Z
May 11, 06Z
May 11, 12Z
May 11, 18Z
May 12, 06Z
May 12, 12Z
May 12, 18Z
May 13, 06Z
May 13, 12Z
May 13, 18Z
May 14, 18Z
May 15, 18Z
May 16, 06Z
May 16, 18Z
May 18, 06Z
May 18, 12Z
May 20, 18Z
May 21, 06Z
May 21, 12Z
May 21, 18Z
May 22, 06Z
May 23, 06Z

Comments
Post a Comment