Verification of tracks made of Delta
I made nine sets of tracks of Hurricane Delta, before it was
assessed as
a tropical cyclone. In one analysis, there were two tracks, based on
assumption, that Gamma and Delta would merge into broad low, later developing into a third separate cyclone. I made three more tracks after
cyclogenesis.
Additionally, within 480 hours of cyclogenesis, there was one instance,
when I missed cyclogenesis entirely.
As of this analysis, best track positions are available October 2, 12Z
thru October 12, 00Z, and as such, position comparisons are possible only
for this timespan.
Since I give only SSHS categories in my tracks, I don't
calculate intensity errors in units of speed, but in categories. For
this purpose, I define tropical or subtropical storms as "Category 0", tropical
or subtropical depressions as "Category -1" and non-existence of a tropical or subtropical cyclone as
"Category -2".
In the nine tracks (made before operationally recognized cyclogenesis),
formation times ranged between October 4, 00Z and October 8, 12Z. Average
was October 6, 10Z and median was October 6, 18Z.
In the ten cases (9 tracks, before the tracks and data agreed, that
Category 4 would remain the peak intensity, and 1 complete
miss), peak intensity ranged between Category -2 and Category 5. Average was Category 2.10 and median was Category 1.5.
In the twelve tracks (made before operationally recognized extratropical
transition), dissipation times ranged between October 10, 12Z
and October 21, 18Z. Average was October 13, 13Z and median was October 12, 15Z.
At the lead time of 1 day (24 hours), there were 2 hits, 0 false detections and 0 misses. 2 available position comparisons produce an average error of 10 nautical miles.
At the lead time of 2 days (48 hours), there were 1 hit, 0 false detections and 1 miss. 1 available position comparison produces an average error of 49 nautical miles.
At the lead time of 3 days (72 hours), there were 0 hits, 0 false detections and 1 miss. 1 available position comparison produces an average error of 100 nautical miles.
At the lead time of 4 days (96 hours), there were 1 hit, 0 false detections and 1 miss. 1 available position comparison produces an average error of 156 nautical miles.
At the lead time of 5 days (120 hours), there were 1 hit, 0 false detections and 2 misses. 1 available position comparison produces an average error of 285 nautical miles.
At the lead time of 6 days (144 hours), there were 2 hits, 0 false detections and 1 miss. 2 available position comparisons produce an average error of 200 nautical miles.
At the lead time of 7 days (168 hours), there were 2 hits, 0 false detections and 2 misses. 2 available position comparisons produce an average error of 238 nautical miles.
At the lead time of 8 days (192 hours), there were 2 hits, 1 false detection and 2 misses. 3 available position comparisons produce an average error of 434 nautical miles.
At the lead time of 9 days (216 hours), there were 3 hits, 1 false detection and 2 misses. 3 available position comparisons produce an average error of 421 nautical miles.
At the lead time of 10 days (240 hours), there were 2 hits, 3 false detections and 1 miss. 5 available position comparisons produce an average error of 490 nautical miles.
At the lead time of 11 days (264 hours), there were 4 hits, 2 false detections and 0 misses. 4 available position comparisons produce an average error of 394 nautical miles.
At the lead time of 12 days (288 hours), there were 5 hits, 2 false detections and 0 misses. 5 available position comparisons produce an average error of 455 nautical miles.
At the lead time of 13 days (312 hours), there were 4 hits, 3 false detections and 0 misses. 5 available position comparisons produce an average error of 465 nautical miles.
At the lead time of 14 days (336 hours), there were 3 hits, 4 false detections and 1 miss. 4 available position comparisons produce an average error of 433 nautical miles.
At the lead time of 15 days (360 hours), there were 2 hits, 3 false detections and 1 miss. 2 available position comparisons produce an average error of 427 nautical miles.
At the lead time of 16 days (384 hours), there were 2 hits, 1 false detection and 1 miss. 2 available position comparisons produce an average error of 642 nautical miles.
At the lead time of 17 days (408 hours), there were 2 hits, 1 false detection and 0 misses. 3 available position comparisons produce an average error of 776 nautical miles.
At the lead time of 18 days (432 hours), there were 1 hit, 2 false detections and 0 misses. 2 available position comparisons produce an average error of 827 nautical miles.
At the lead time of 19 days (456 hours), there were 0 hits, 1 false detection and 2 misses. No available position comparisons.
At the lead time of 20 days (480 hours), there were 0 hits, 1 false detection and 1 miss. No available position comparisons.
Circle coloration scheme

Here are the tracks once again.
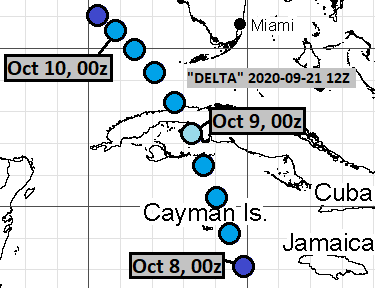
September 21, 12Z:
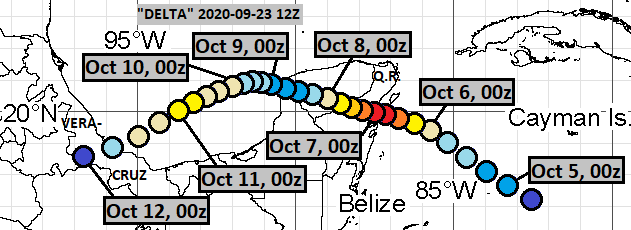
September 23, 12Z:
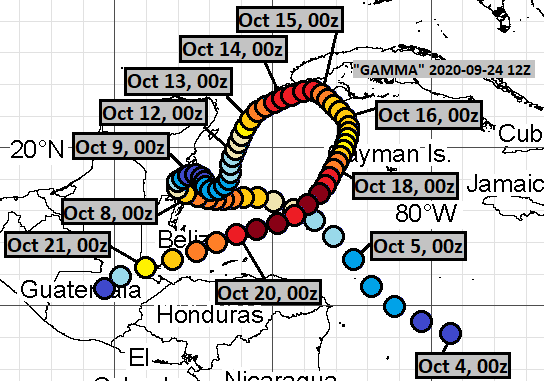
September 24, 12Z:
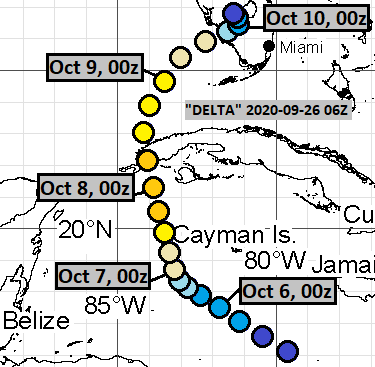
September 26, 06Z:
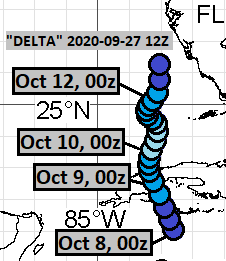
September 27, 12Z:
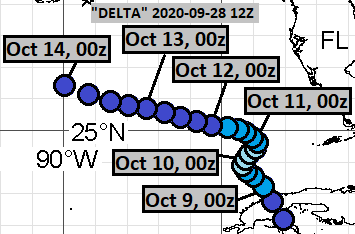
September 28, 12Z:
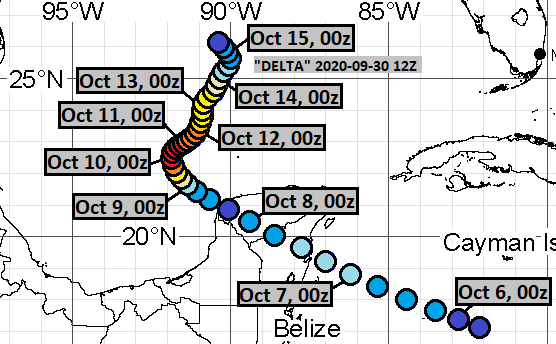
September 30, 12Z:
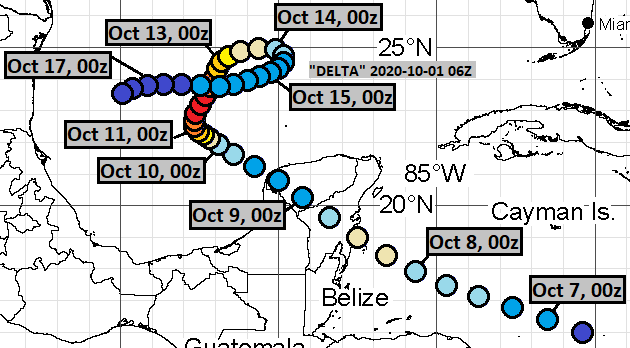
October 1, 06Z:
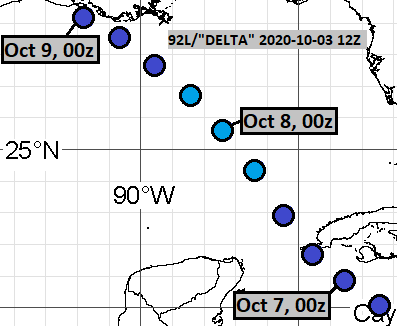
October 3, 12Z (part 1):
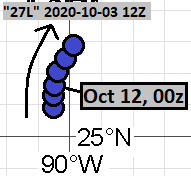
October 3, 12Z (part 2):
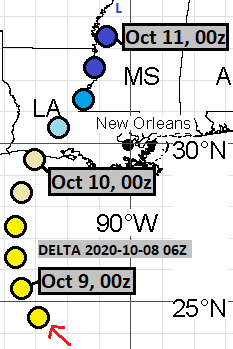
October 8, 06Z:
October 9, 12Z:

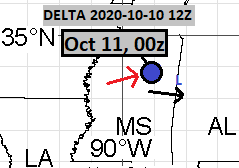
October 10, 12Z:
The complete miss was from the following model cycle:
September 16, 06Z

Comments
Post a Comment