Verification of tracks made of Eta
I made six tracks of Hurricane Eta, before it was assessed as
a tropical cyclone. I made four more tracks after that point. Additionally, within 480
hours of cyclogenesis, there were eight instances,
when I missed cyclogenesis entirely. Mostly I predicted Eta to be too short-lived, due to dissipation in Central America (and subsequent genesis of a completely different system in NW Caribbean soon after, but that will be discussed in another post).
As of this analysis, best track positions are available October 29, 00Z
thru November 13, 06Z, and as such, position comparisons are possible only
for this timespan.
Since I give only SSHS categories in my tracks, I don't
calculate intensity errors in units of speed, but in categories. For
this purpose, I define tropical or subtropical storms as "Category 0", tropical
or subtropical depressions as "Category -1" and non-existence of a tropical or subtropical cyclone as
"Category -2".
In the six tracks (made before operationally recognized cyclogenesis),
formation times ranged between October 28, 00Z and November 1, 18Z. Average
was October 31, 10Z and median was November 1, 12Z.
In the fifteen cases (7 tracks, before the tracks and data agreed, that
Category 4 would remain the peak intensity, and 8 complete
misses), peak intensity ranged between Category -2 and Category 5. Average was Category 0.07 and median was Category -2.
In the ten tracks (made before operationally recognized degeneration), dissipation times ranged between November 2, 00Z
and November 19, 00Z. Average was November 9, 17Z and median was November 9, 00Z.
At the lead time of 1 day (24 hours), there were 4 hits, 0 false detections and 1 miss. 4 available position comparisons produce an average error of 23 nautical miles.
At the lead time of 2 days (48 hours), there were 5 hits, 1 false detection and 0 misses. 5 available position comparisons produce an average error of 71 nautical miles.
At the lead time of 3 days (72 hours), there were 4 hits, 0 false detections and 1 miss. 5 available position comparisons produce an average error of 146 nautical miles.
At the lead time of 4 days (96 hours), there were 3 hits, 1 false detection and 1 miss. 4 available position comparisons produce an average error of 180 nautical miles.
At the lead time of 5 days (120 hours), there were 0 hits, 2 false detections and 5 misses. 1 available position comparison produces an average error of 464 nautical miles.
At the lead time of 6 days (144 hours), there were 1 hit, 2 false detections and 4 misses. 1 available position comparison produces an average error of 500 nautical miles.
At the lead time of 7 days (168 hours), there were 1 hit, 2 false detections and 4 misses. 1 available position comparison produces an average error of 425 nautical miles.
At the lead time of 8 days (192 hours), there were 1 hit, 2 false detections and 5 misses. 1 available position comparison produces an average error of 433 nautical miles.
At the lead time of 9 days (216 hours), there were 1 hit, 1 false detection and 5 misses. 1 available position comparison produces an average error of 304 nautical miles.
At the lead time of 10 days (240 hours), there were 1 hit, 0 false detections and 6 misses. 1 available position comparison produces an average error of 135 nautical miles.
At the lead time of 11 days (264 hours), there were 0 hits, 0 false detections and 6 misses. No available position comparisons.
At the lead time of 12 days (288 hours), there were 0 hits, 0 false detections and 6 misses. No available position comparisons.
At the lead time of 13 days (312 hours), there were 0 hits, 1 false detection and 6 misses. No available position comparisons.
At the lead time of 14 days (336 hours), there were 0 hits, 1 false detection and 5 misses. 1 available position comparison produces an average error of 959 nautical miles.
At the lead time of 15 days (360 hours), there were 0 hits, 1 false detection and 6 misses. 1 available position comparison produces an average error of 875 nautical miles.
At the lead time of 16 days (384 hours), there were 2 hits, 0 false detections and 6 misses. 2 available position comparisons produce an average error of 373 nautical miles.
At the lead time of 17 days (408 hours), there were 3 hits, 0 false detections and 4 misses. 3 available position comparisons produce an average error of 227 nautical miles.
At the lead time of 18 days (432 hours), there were 3 hits, 1 false detection and 4 misses. 4 available position comparisons produce an average error of 456 nautical miles.
At the lead time of 19 days (456 hours), there were 1 hit, 1 false detection and 7 misses. 2 available position comparisons produce an average error of 495 nautical miles.
At the lead time of 20 days (480 hours), there were 2 hits, 0 false detections and 7 misses. 2 available position comparisons produce an average error of 399 nautical miles.
Circle coloration scheme

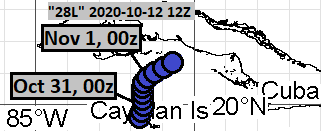
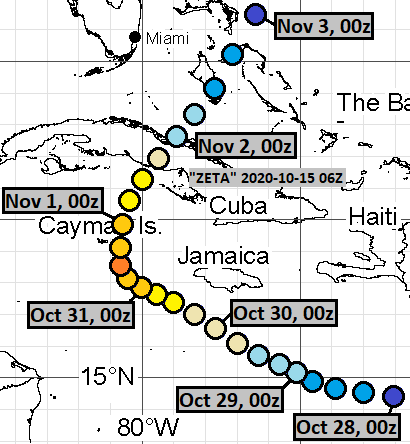
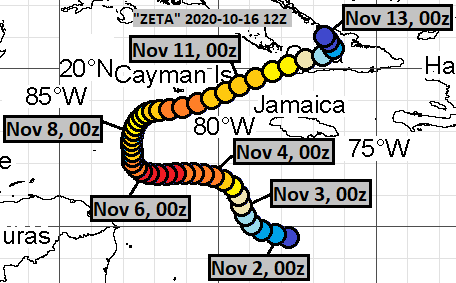
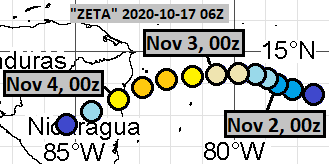
Here are the tracks once again.
October 12, 12Z:
October 15, 06Z:
October 16, 12Z:
October 17, 06Z:
October 30, 12Z:

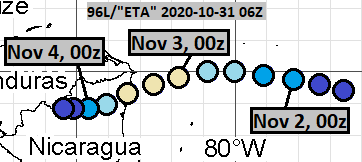
October 31, 06Z:
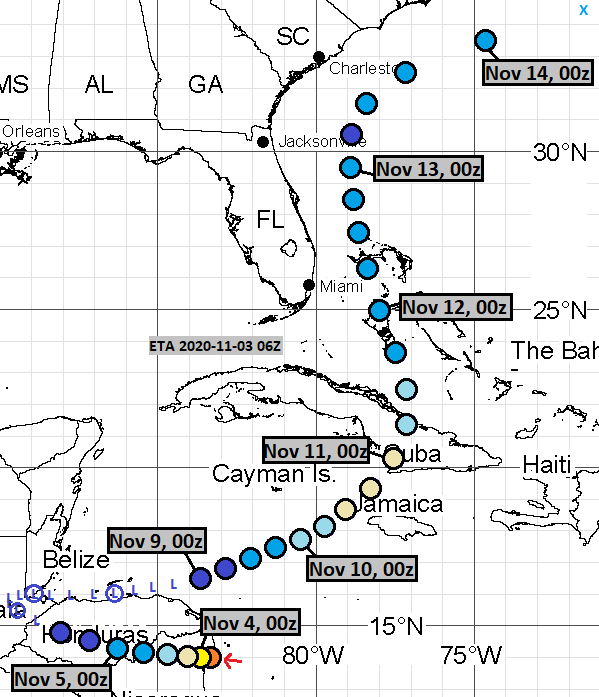
November 3, 06Z:
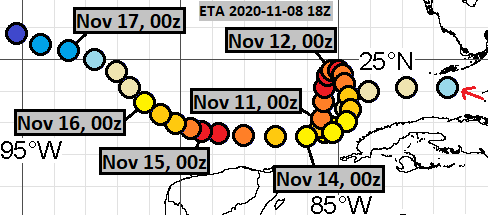
November 8, 18Z:
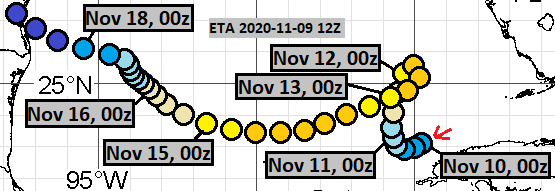
November 9, 12Z:
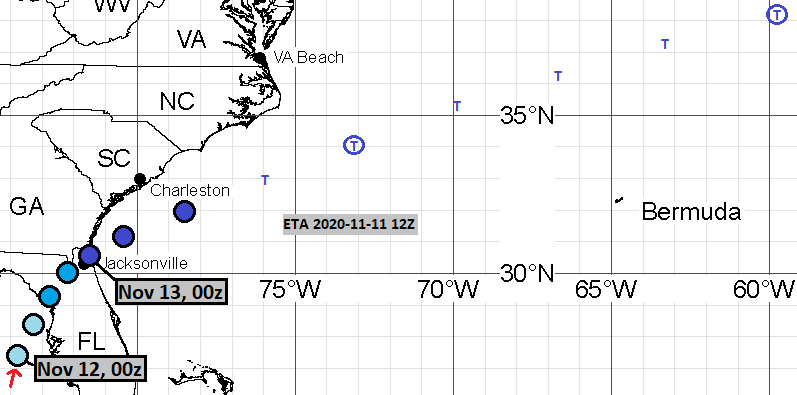
November 11, 12Z:
The complete misses were from the following model cycles:
October 11, 18Z
October 13, 12Z
October 14, 12Z
October 18, 12Z
October 22, 12Z
October 24, 12Z
October 27, 00Z
October 28, 06Z

Comments
Post a Comment