Verification of tracks made of Genevieve
I made fourteen tracks of Hurricane Genevieve, before it was assessed as
a tropical cyclone. I made two more tracks after that point. Within 480
hours of cyclogenesis, there were no instances,
when I missed cyclogenesis entirely.
As of this analysis, best track positions are available August 14, 06Z
thru August 21, 18Z, and as such, position comparisons are possible only
for this timespan.
Since I give only SSHS categories in my tracks, I don't
calculate intensity errors in units of speed, but in categories. For
this purpose, I define tropical or subtropical storms as "Category 0", tropical
or subtropical depressions as "Category -1" and non-existence of a tropical or subtropical cyclone as
"Category -2".
In the fourteen tracks (made before operationally recognized cyclogenesis),
formation times ranged between August 12, 06Z and August 16, 18Z. Average
was August 14, 18Z and median was August 15, 09Z.
In the fourteen cases (14 tracks, before the tracks and data agreed, that Category 4 would remain the peak intensity, and 0 complete
misses), peak intensity ranged between Category 0 and Category 5.
Average was Category 3.21 and median was Category 3.5.
In the sixteen tracks (made before operationally recognized degeneration into remnant low), dissipation times ranged between August 15, 18Z
and August 24, 18Z. Average was August 21, 16Z and median was August 22, 12Z.
At the lead time of 1 day (24 hours), there were 2 hits, 0 false detections and 0 misses. 2 available position comparisons produce an average error of 41 nautical miles.
At the lead time of 2 days (48 hours), there were 2 hits, 1 false detection and 0 misses. 2 available position comparisons produce an average error of 109 nautical miles.
At the lead time of 3 days (72 hours), there were 2 hits, 0 false detections and 0 misses. 2 available position comparisons produce an average error of 180 nautical miles.
At the lead time of 4 days (96 hours), there were 2 hits, 1 false detection and 0 misses. 2 available position comparisons produce an average error of 216 nautical miles.
At the lead time of 5 days (120 hours), there were 2 hits, 1 false detection and 0 misses. 2 available position comparisons produce an average error of 252 nautical miles.
At the lead time of 6 days (144 hours), there were 3 hits, 0 false detections and 0 misses. 3 available position comparisons produce an average error of 217 nautical miles.
At the lead time of 7 days (168 hours), there were 2 hits, 1 false detection and 0 misses. 2 available position comparisons produce an average error of 273 nautical miles.
At the lead time of 8 days (192 hours), there were 3 hits, 0 false detections and 0 misses. 3 available position comparisons produce an average error of 278 nautical miles.
At the lead time of 9 days (216 hours), there were 3 hits, 1 false detection and 0 misses. 4 available position comparisons produce an average error of 273 nautical miles.
At the lead time of 10 days (240 hours), there were 4 hits, 1 false detection and 0 misses. 4 available position comparisons produce an average error of 219 nautical miles.
At the lead time of 11 days (264 hours), there were 5 hits, 2 false detections and 0 misses. 6 available position comparisons produce an average error of 203 nautical miles.
At the lead time of 12 days (288 hours), there were 5 hits, 4 false detections and 0 misses. 6 available position comparisons produce an average error of 262 nautical miles.
At the lead time of 13 days (312 hours), there were 4 hits, 4 false detections and 0 misses. 6 available position comparisons produce an average error of 378 nautical miles.
At the lead time of 14 days (336 hours), there were 5 hits, 4 false detections and 0 misses. 7 available position comparisons produce an average error of 571 nautical miles.
At the lead time of 15 days (360 hours), there were 4 hits, 4 false detections and 0 misses. 7 available position comparisons produce an average error of 606 nautical miles.
At the lead time of 16 days (384 hours), there were 2 hits, 3 false detections and 1 miss. 5 available position comparisons produce an average error of 889 nautical miles.
At the lead time of 17 days (408 hours), there were 3 hits, 4 false detections and 0 misses. 5 available position comparisons produce an average error of 1005 nautical miles.
At the lead time of 18 days (432 hours), there were 4 hits, 2 false detections and 0 misses. 6 available position comparisons produce an average error of 1053 nautical miles.
At the lead time of 19 days (456 hours), there were 4 hits, 1 false detection and 0 misses. 5 available position comparisons produce an average error of 1182 nautical miles.
At the lead time of 20 days (480 hours), there were 2 hits, 1 false detection and 3 misses. 2 available position comparisons produce an average error of 1420 nautical miles.
Circle coloration scheme

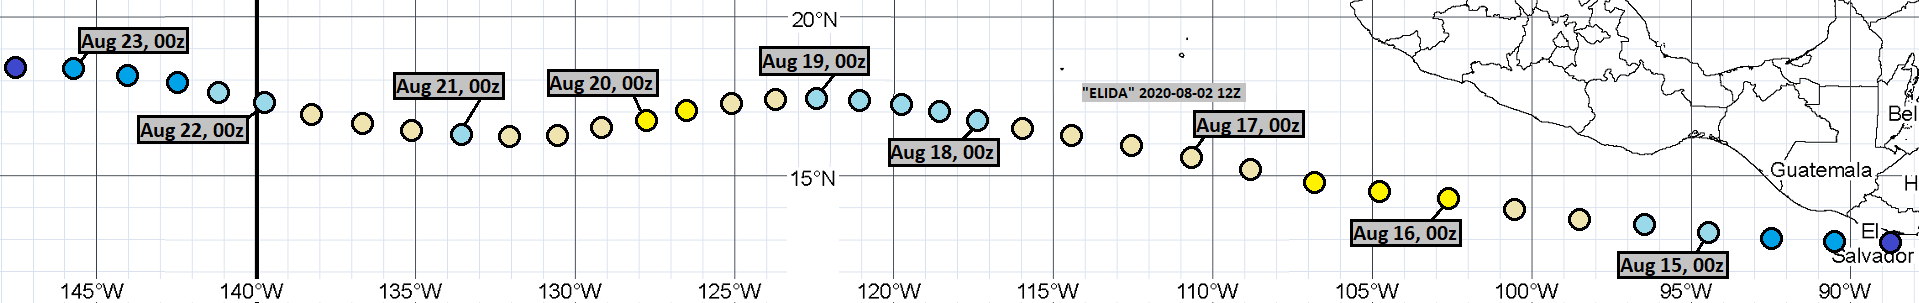
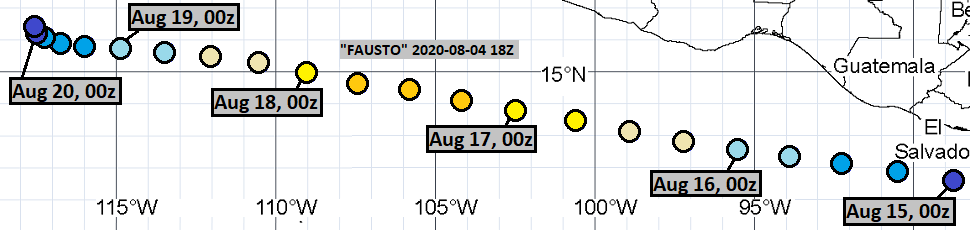
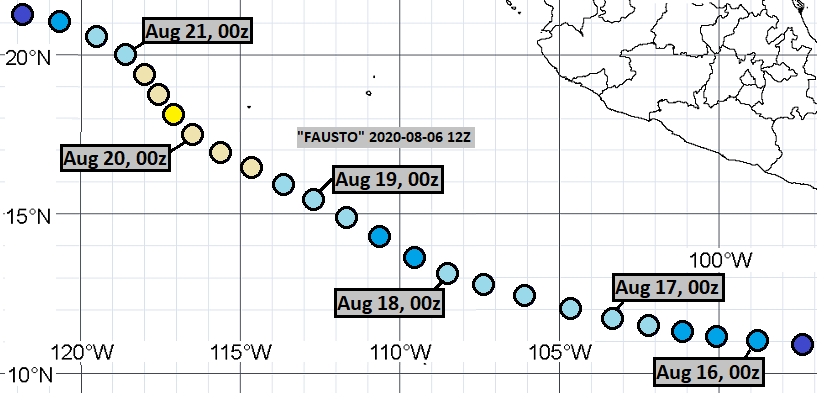
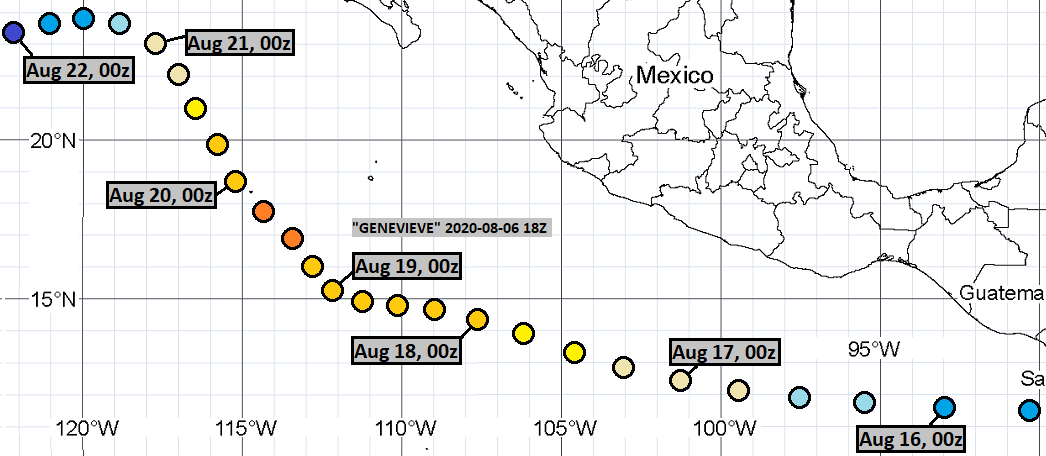
Here are the tracks once again.
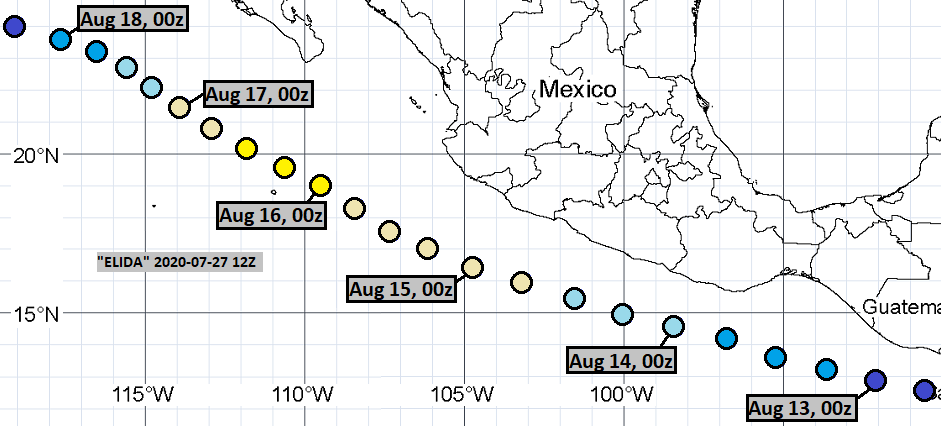
July 27, 12Z:
July 28, 06Z:

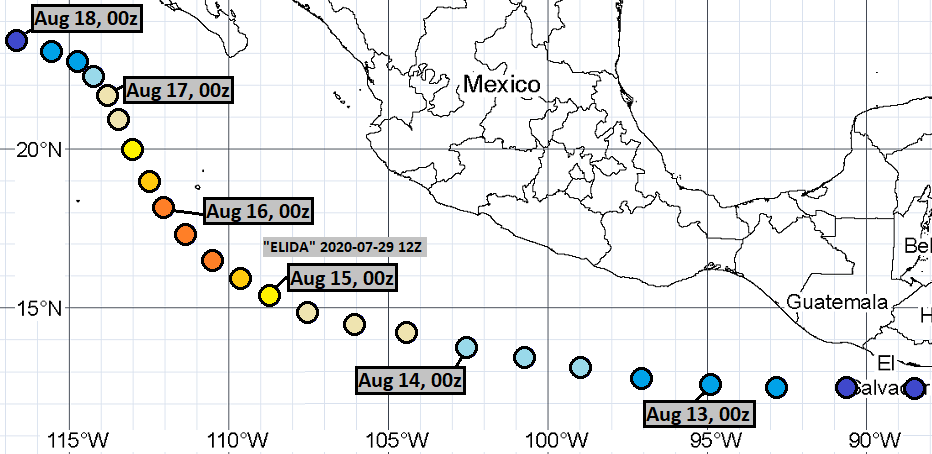
July 29, 12Z:
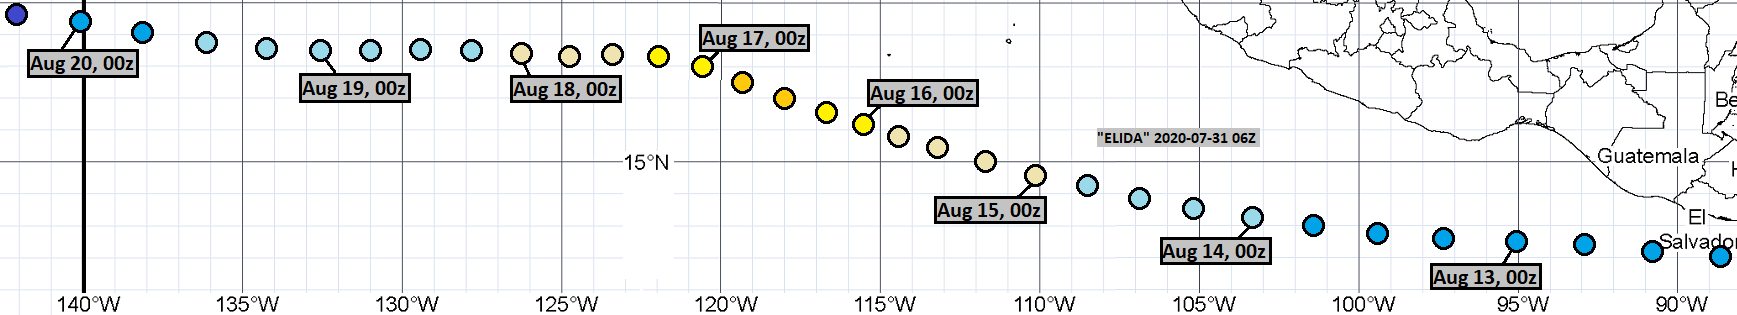
July 31, 06Z:
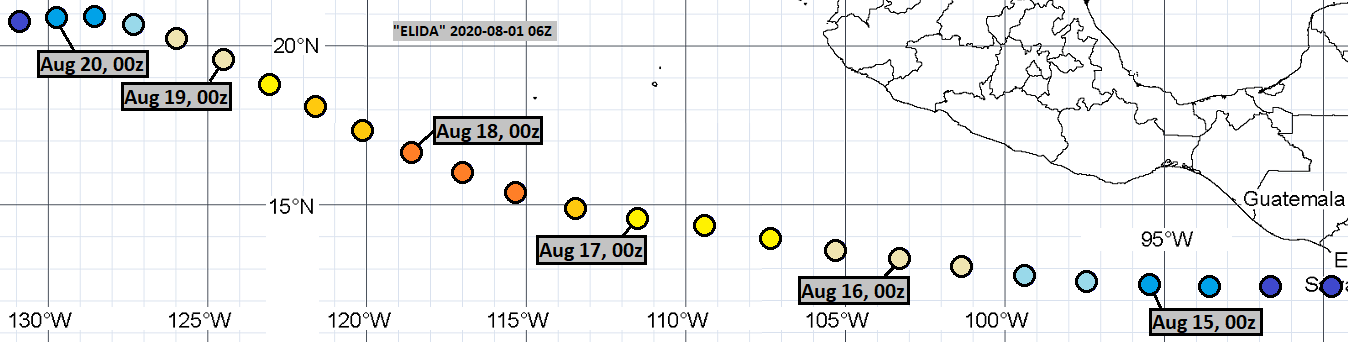
August 1, 06Z:
August 2, 12Z:
August 4, 18Z:
August 5, 18Z:

August 6, 12Z:
August 6, 18Z:
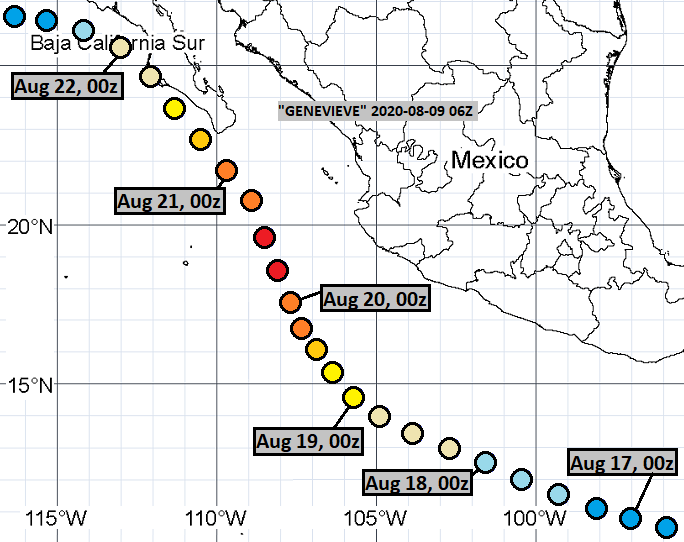
August 9, 06Z:
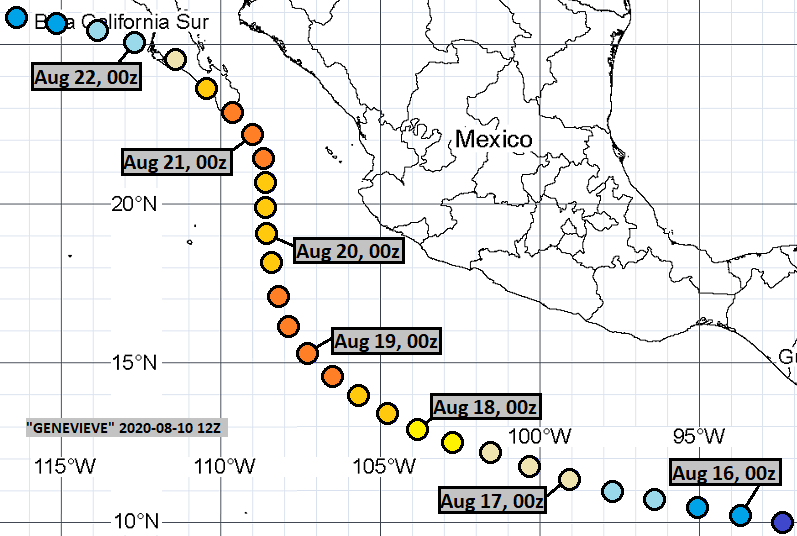
August 10, 12Z:
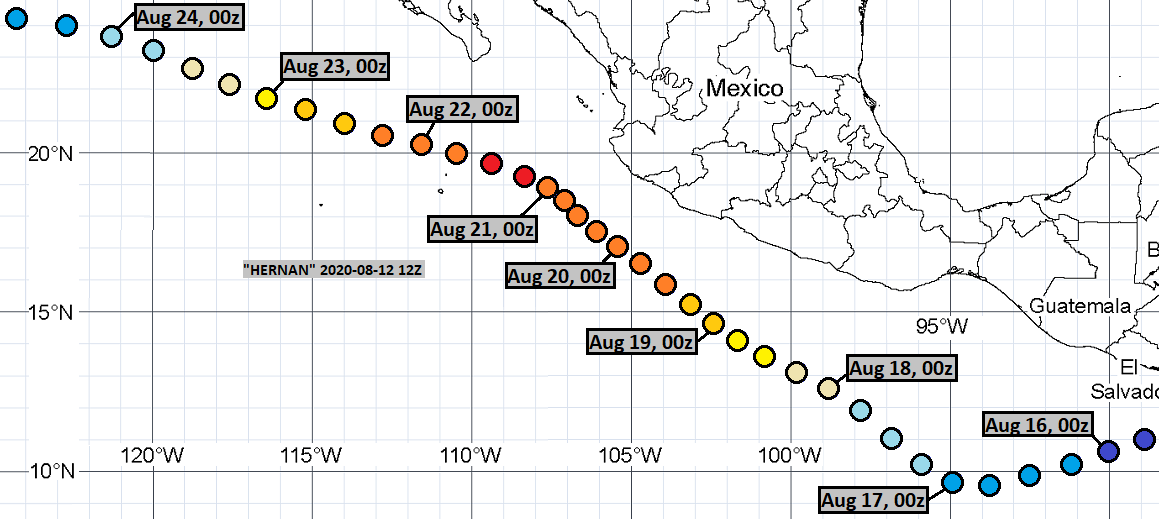
August 12, 12Z:
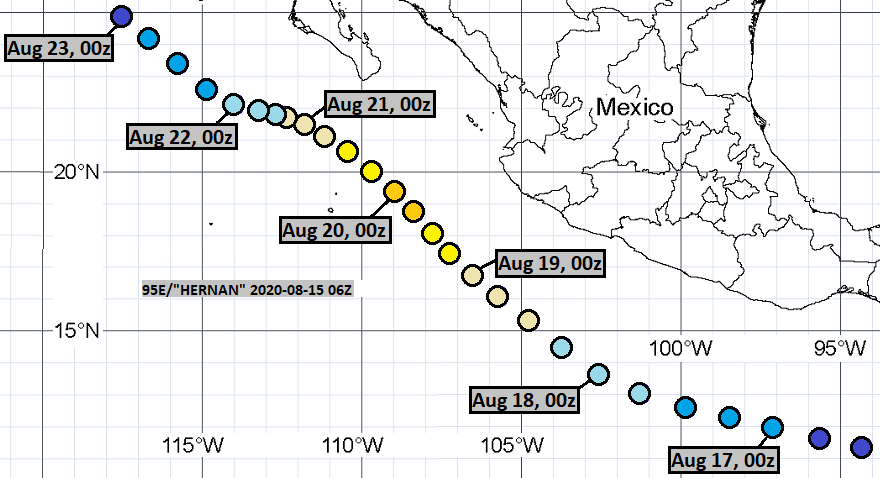
August 15, 06Z:
August 18, 12Z:

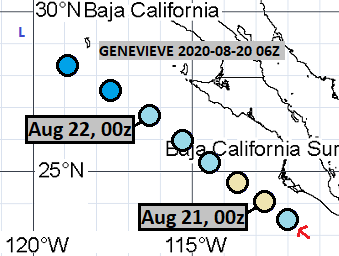
August 20, 06Z:

Comments
Post a Comment