Verification of tracks made of Iota
I made nine tracks of Hurricane Iota, before it was assessed as
a tropical cyclone. I made three more tracks after that point. Within 480
hours of cyclogenesis, there were no instances,
when I missed cyclogenesis entirely.
As of this analysis, best track positions are available November 12, 12Z
thru November 18, 12Z, and as such, position comparisons are possible only
for this timespan.
Since I give only SSHS categories in my tracks, I don't
calculate intensity errors in units of speed, but in categories. For
this purpose, I define tropical or subtropical storms as "Category 0", tropical
or subtropical depressions as "Category -1" and non-existence of a tropical or subtropical cyclone as
"Category -2".
In the nine tracks (made before operationally recognized cyclogenesis),
formation times ranged between November 7, 12Z and November 17, 00Z. Average
was November 13, 03Z and median was November 13, 06Z.
In the ten cases (10 tracks, before the tracks and data agreed, that
Category 5 would remain the peak intensity, and 0 complete
misses), peak intensity ranged between Category -1 and Category 5. Average was Category 1.70 and median was Category +1.5.
In the twelve tracks (made before operationally recognized degeneration), dissipation times ranged between November 13, 12Z
and November 21, 00Z. Average was November 18, 08Z and median was November 18, 18Z.
At the lead time of 1 day (24 hours), there were 2 hits, 0 false detections and 0 misses. 2 available position comparisons produce an average error of 45 nautical miles.
At the lead time of 2 days (48 hours), there were 2 hits, 1 false detection and 0 misses. 3 available position comparisons produce an average error of 75 nautical miles.
At the lead time of 3 days (72 hours), there were 1 hit, 1 false detection and 0 misses. 2 available position comparisons produce an average error of 123 nautical miles.
At the lead time of 4 days (96 hours), there were 1 hit, 0 false detections and 1 miss. 1 available position comparison produces an average error of 178 nautical miles.
At the lead time of 5 days (120 hours), there were 1 hit, 0 false detections and 2 misses. 1 available position comparison produces an average error of 300 nautical miles.
At the lead time of 6 days (144 hours), there were 1 hit, 0 false detections and 2 misses. 1 available position comparison produces an average error of 385 nautical miles.
At the lead time of 7 days (168 hours), there were 1 hit, 1 false detection and 0 misses. 2 available position comparisons produce an average error of 260 nautical miles.
At the lead time of 8 days (192 hours), there were 1 hit, 0 false detections and 1 miss. 1 available position comparison produces an average error of 285 nautical miles.
At the lead time of 9 days (216 hours), there were 1 hit, 1 false detection and 0 misses. 2 available position comparisons produce an average error of 313 nautical miles.
At the lead time of 10 days (240 hours), there were 0 hits, 2 false detections and 0 misses. No available position comparisons.
At the lead time of 11 days (264 hours), there were 0 hits, 2 false detections and 1 miss. No available position comparisons.
At the lead time of 12 days (288 hours), there were 1 hit, 2 false detections and 0 misses. 1 available position comparison produces an average error of 777 nautical miles.
At the lead time of 13 days (312 hours), there were 1 hit, 2 false detections and 0 misses. 2 available position comparisons produce an average error of 452 nautical miles.
At the lead time of 14 days (336 hours), there were 1 hit, 1 false detection and 2 misses. 1 available position comparison produces an average error of 251 nautical miles.
At the lead time of 15 days (360 hours), there were 1 hit, 1 false detection and 2 misses. 1 available position comparison produces an average error of 353 nautical miles.
At the lead time of 16 days (384 hours), there were 1 hit, 3 false detections and 1 miss. 2 available position comparisons produce an average error of 394 nautical miles.
At the lead time of 17 days (408 hours), there were 2 hits, 2 false detections and 1 miss. 3 available position comparisons produce an average error of 517 nautical miles.
At the lead time of 18 days (432 hours), there were 2 hits, 1 false detection and 2 misses. 2 available position comparisons produce an average error of 585 nautical miles.
At the lead time of 19 days (456 hours), there were 1 hit, 2 false detections and 1 miss. 3 available position comparisons produce an average error of 783 nautical miles.
At the lead time of 20 days (480 hours), there were 1 hit, 1 false detection and 2 misses. 1 available position comparison produces an average error of 546 nautical miles.
Circle coloration scheme

Here are the tracks once again.
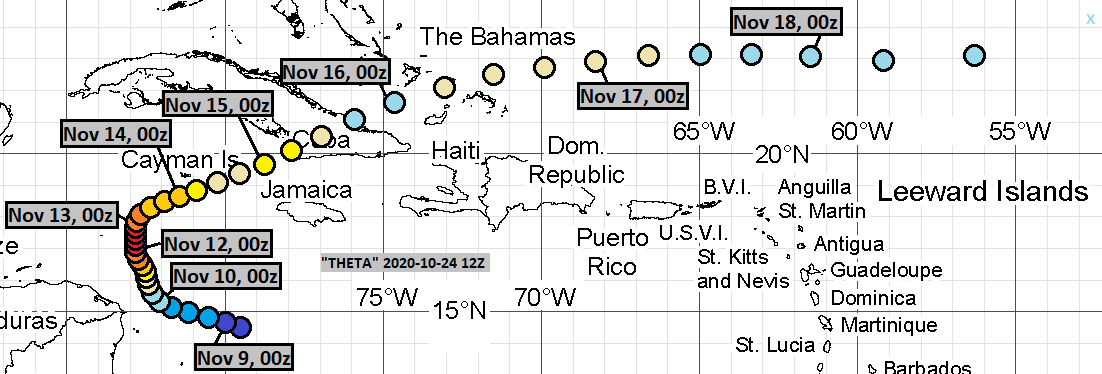
October 24, 12Z:
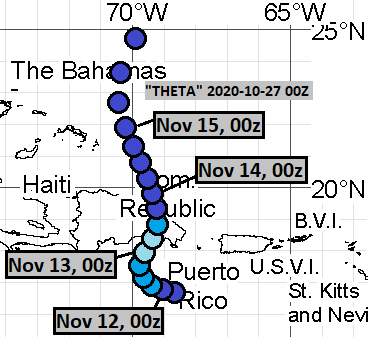
October 27, 00Z:
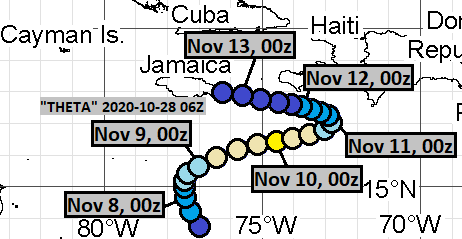
October 28, 06Z:
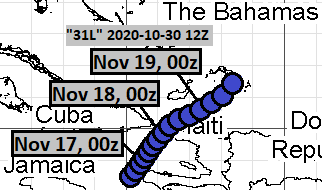
October 30, 12Z:
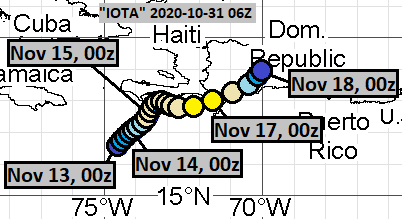
October 31, 06Z:
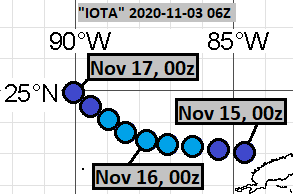
November 3, 06Z:
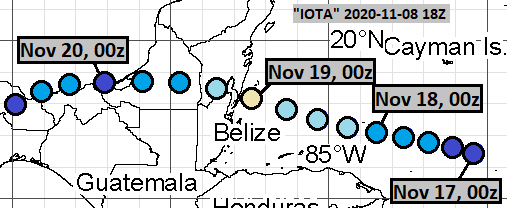
November 8, 18Z:
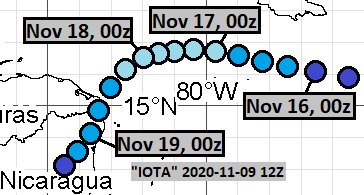
November 9, 12Z:
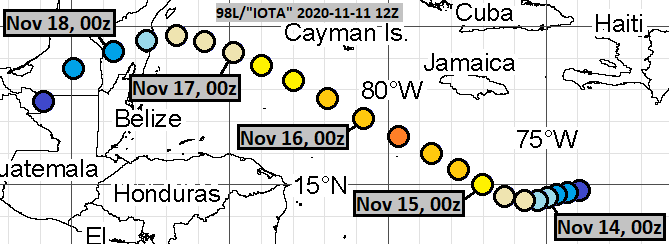
November 11, 12Z:
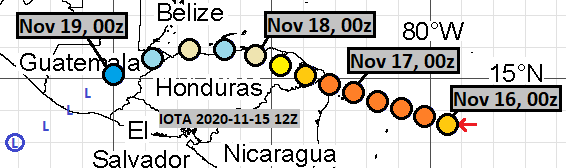
November 15, 12Z:
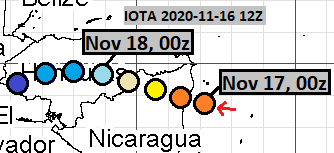
November 16, 12Z:
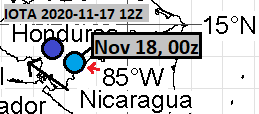
November 17, 12Z:

Comments
Post a Comment