Verification of tracks made of Paulette
I made six tracks of Hurricane Paulette, before it was
assessed as
a tropical cyclone. I
made two more tracks after that point.
Additionally, within 480 hours of cyclogenesis, there were three
instances,
when I missed cyclogenesis entirely. Detection rate was good, and so was position accuracy.
As of this analysis, best track positions are available September 3, 12Z
thru September 23, 18Z, and as such, position comparisons are possible only
for this timespan.
Since I give only SSHS categories in my tracks, I don't
calculate intensity errors in units of speed, but in categories. For
this purpose, I define tropical or subtropical storms as "Category 0", tropical
or subtropical depressions as "Category -1" and non-existence of a tropical or subtropical cyclone as
"Category -2".
In the six tracks (made before operationally recognized cyclogenesis),
formation times ranged between September 3, 12Z and September 14, 06Z. Average
was September 6, 03Z and median was September 4, 09Z.
In the ten cases (7 tracks, before the tracks and data agreed, that Category 2 would remain the peak intensity, and 3 complete
misses), peak intensity ranged between Category -2 and Category 5.
Average was Category 1.40 and median was Category 2.5.
In the eight tracks (made before operationally recognized final degeneration into remnant low), dissipation times ranged between September 9, 12Z
and October 7, 12Z. Average was September 20, 05Z and median was September 17, 21Z.
At the lead time of 1 day (24 hours), there were 3 hits, 1 false detection and 0 misses. 4 available position comparisons produce an average error of 52 nautical miles.
At the lead time of 2 days (48 hours), there were 2 hits, 1 false detection and 0 misses. 3 available position comparisons produce an average error of 75 nautical miles.
At the lead time of 3 days (72 hours), there were 2 hits, 1 false detection and 0 misses. 3 available position comparisons produce an average error of 90 nautical miles.
At the lead time of 4 days (96 hours), there were 3 hits, 0 false detections and 0 misses. 3 available position comparisons produce an average error of 134 nautical miles.
At the lead time of 5 days (120 hours), there were 2 hits, 3 false detections and 0 misses. 5 available position comparisons produce an average error of 268 nautical miles.
At the lead time of 6 days (144 hours), there were 2 hits, 3 false detections and 1 miss. 5 available position comparisons produce an average error of 314 nautical miles.
At the lead time of 7 days (168 hours), there were 1 hit, 2 false detections and 2 misses. 3 available position comparisons produce an average error of 294 nautical miles.
At the lead time of 8 days (192 hours), there were 2 hits, 1 false detection and 2 misses. 3 available position comparisons produce an average error of 191 nautical miles.
At the lead time of 9 days (216 hours), there were 3 hits, 0 false detections and 2 misses. 3 available position comparisons produce an average error of 169 nautical miles.
At the lead time of 10 days (240 hours), there were 3 hits, 0 false detections and 3 misses. 3 available position comparisons produce an average error of 175 nautical miles.
At the lead time of 11 days (264 hours), there were 2 hits, 0 false detections and 3 misses. 2 available position comparisons produce an average error of 210 nautical miles.
At the lead time of 12 days (288 hours), there were 2 hits, 0 false detections and 3 misses. 2 available position comparisons produce an average error of 348 nautical miles.
At the lead time of 13 days (312 hours), there were 2 hits, 0 false detections and 3 misses. 2 available position comparisons produce an average error of 482 nautical miles.
At the lead time of 14 days (336 hours), there were 2 hits, 0 false detections and 3 misses. 2 available position comparisons produce an average error of 564 nautical miles.
At the lead time of 15 days (360 hours), there were 2 hits, 0 false detections and 3 misses. 2 available position comparisons produce an average error of 568 nautical miles.
At the lead time of 16 days (384 hours), there were 2 hits, 0 false detections and 4 misses. 2 available position comparisons produce an average error of 681 nautical miles.
At the lead time of 17 days (408 hours), there were 1 hit, 1 false detection and 3 misses. 2 available position comparisons produce an average error of 1052 nautical miles.
At the lead time of 18 days (432 hours), there were 2 hits, 1 false detection and 2 misses. 3 available position comparisons produce an average error of 1065 nautical miles.
At the lead time of 19 days (456 hours), there were 1 hit, 2 false detections and 3 misses. 3 available position comparisons produce an average error of 1222 nautical miles.
At the lead time of 20 days (480 hours), there were 1 hit, 2 false detections and 3 misses. 3 available position comparisons produce an average error of 1417 nautical miles.
Circle coloration scheme

Here are the tracks once again.
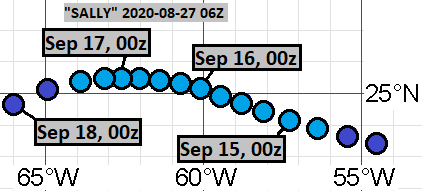
August 27, 06Z:
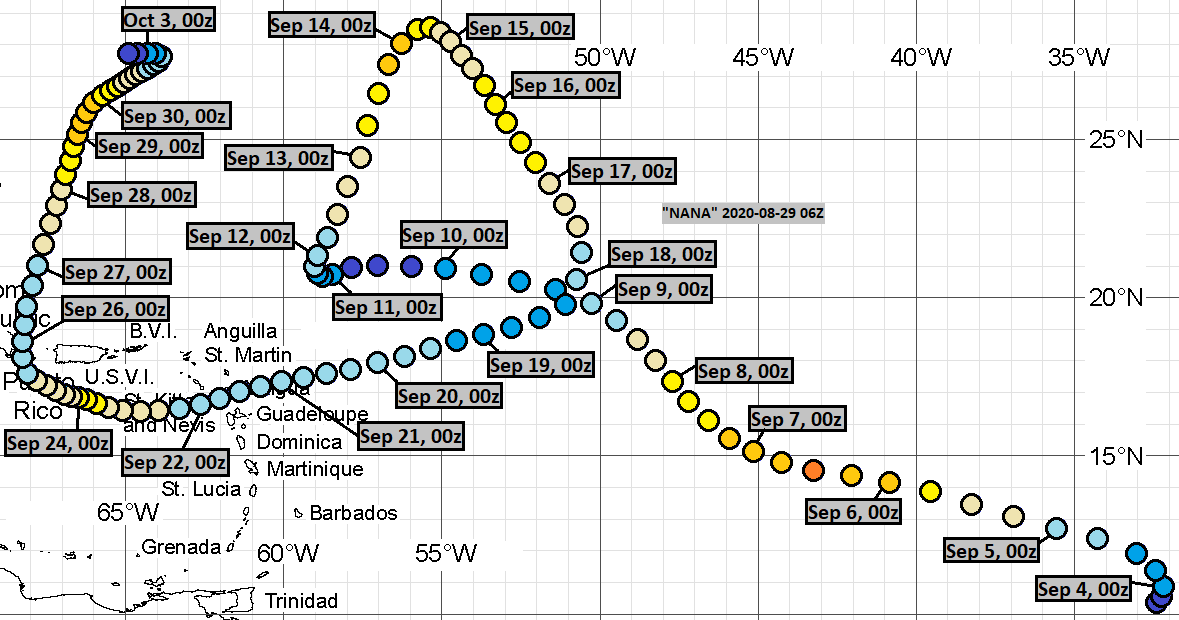
August 29, 06Z:
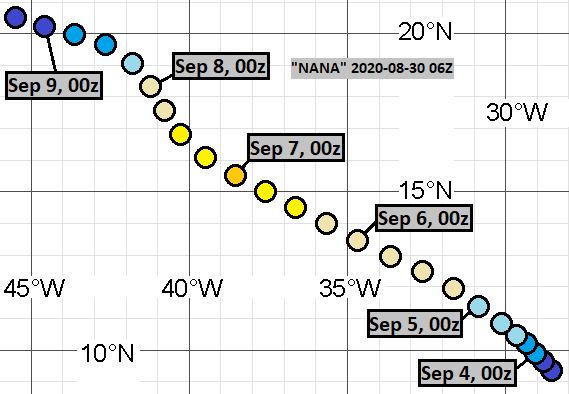
August 30, 06Z:
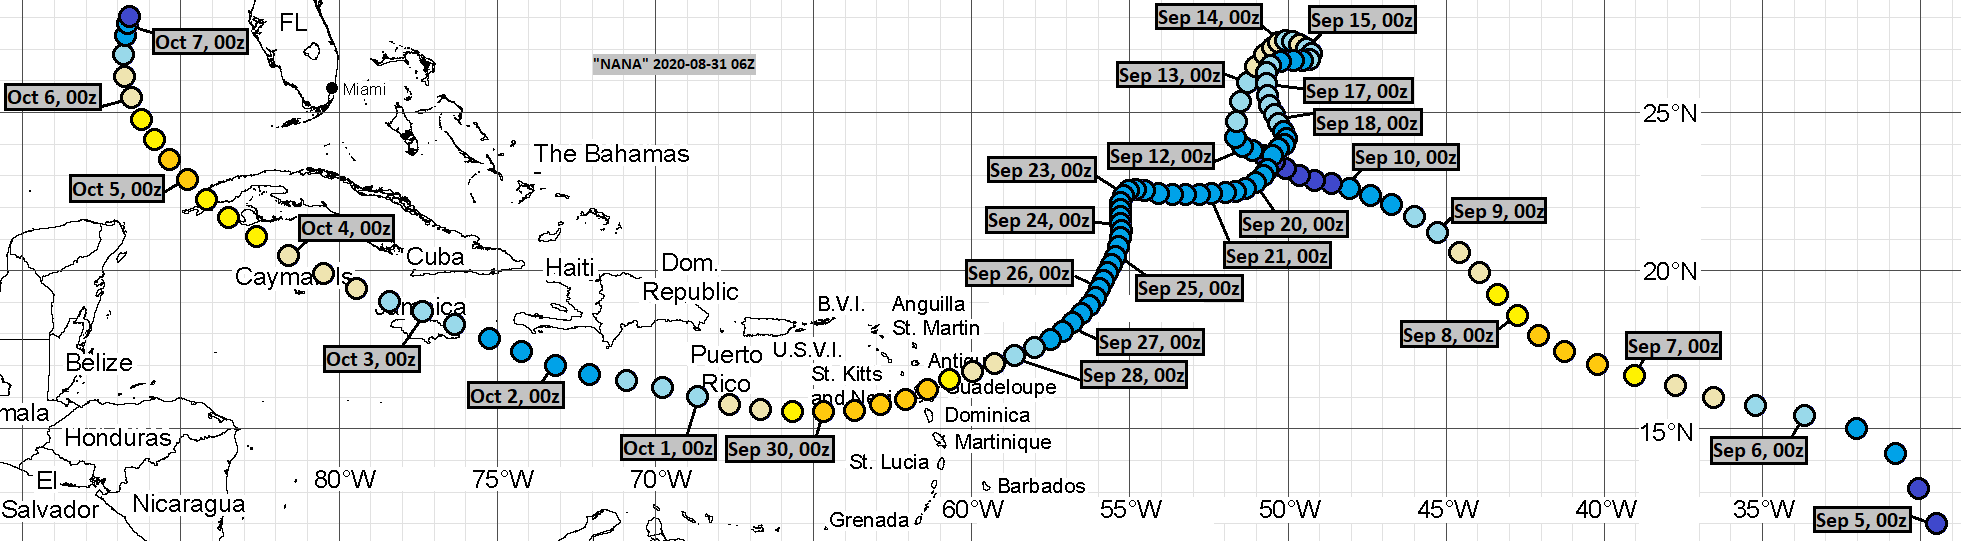
August 31, 06Z:
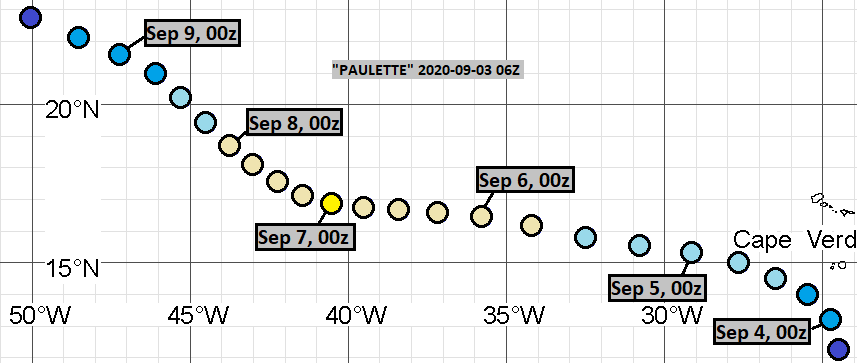
September 3, 06Z:
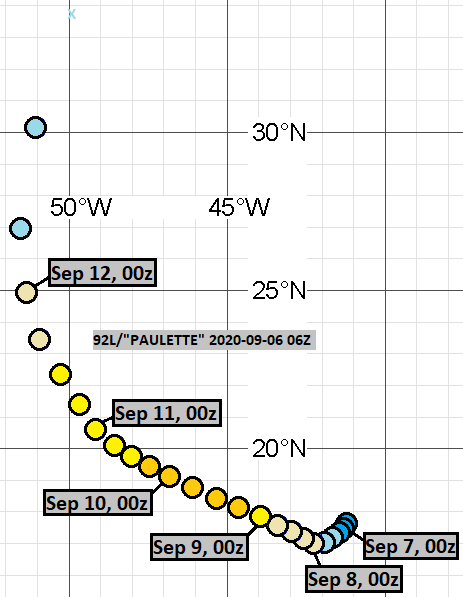
September 6, 06Z:
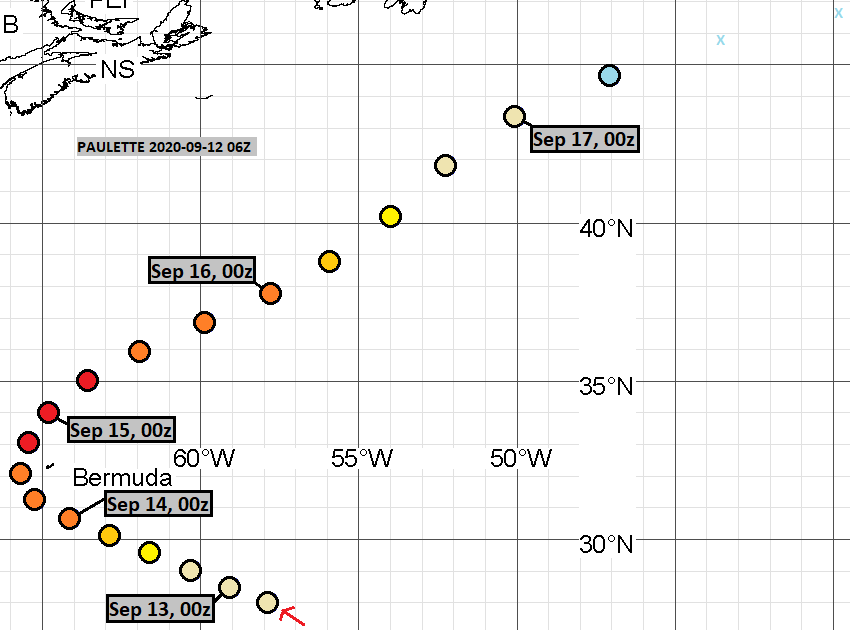
September 12, 06Z:
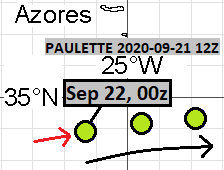
September 21, 12Z:
The complete misses were from the following model cycles:
August 18, 12Z
August 20, 06Z
August 24, 06Z

Comments
Post a Comment