Verification of tracks made of Rene
I made ten tracks of Tropical Storm Rene, before it was assessed as
a tropical cyclone. I made one more track after that point. Within 480 hours of cyclogenesis, there were no instances,
when I missed cyclogenesis entirely. Detection rate was great, and position accuracy was too. Peak intensity was not so well predicted.
As of this analysis, best track positions are available September 5, 12Z
thru September 14, 18Z, and as such, position comparisons are possible only
for this timespan.
Since I give only SSHS categories in my tracks, I don't
calculate intensity errors in units of speed, but in categories. For
this purpose, I define tropical or subtropical storms as "Category 0", tropical
or subtropical depressions as "Category -1" and non-existence of a tropical or subtropical cyclone as
"Category -2".
In the ten tracks (made before operationally recognized cyclogenesis),
formation times ranged between August 31, 12Z and September 8, 18Z. Average
was September 6, 14Z and median was September 7, 03Z.
In the ten cases (10 tracks, before the tracks and data agreed, that
tropical storm would remain the peak intensity, and 0 complete
misses), peak intensity ranged between Category 0 and Category 4.
Average was Category 1.50 and median was Category 2.
In the eleven tracks (made before operationally recognized degeneration
into
remnant low), dissipation times ranged between September 11, 00Z
and September 29, 06Z. Average was September 16, 23Z and median was September 12, 18Z.
At the lead time of 1 day (24 hours), there were 1 hit, 1 false detection and 0 misses. 2 available position comparisons produce an average error of 47 nautical miles.
At the lead time of 2 days (48 hours), there were 2 hits, 0 false detections and 0 misses. 2 available position comparisons produce an average error of 48 nautical miles.
At the lead time of 3 days (72 hours), there were 1 hit, 0 false detections and 0 misses. 1 available position comparison produces an average error of 52 nautical miles.
At the lead time of 4 days (96 hours), there were 1 hit, 1 false detection and 0 misses. 2 available position comparisons produce an average error of 86 nautical miles.
At the lead time of 5 days (120 hours), there were 2 hits, 0 false detections and 0 misses. 2 available position comparisons produce an average error of 146 nautical miles.
At the lead time of 6 days (144 hours), there were 1 hit, 0 false detections and 1 miss. 1 available position comparison produces an average error of 165 nautical miles.
At the lead time of 7 days (168 hours), there were 1 hit, 0 false detections and 1 miss. 1 available position comparison produces an average error of 194 nautical miles.
At the lead time of 8 days (192 hours), there were 1 hit, 0 false detections and 2 misses. 1 available position comparison produces an average error of 177 nautical miles.
At the lead time of 9 days (216 hours), there were 2 hits, 1 false detection and 1 miss. 3 available position comparisons produce an average error of 337 nautical miles.
At the lead time of 10 days (240 hours), there were 3 hits, 0 false detections and 1 miss. 3 available position comparisons produce an average error of 487 nautical miles.
At the lead time of 11 days (264 hours), there were 2 hits, 0 false detections and 2 misses. 2 available position comparisons produce an average error of 551 nautical miles.
At the lead time of 12 days (288 hours), there were 2 hits, 0 false detections and 2 misses. 2 available position comparisons produce an average error of 372 nautical miles.
At the lead time of 13 days (312 hours), there were 1 hit, 0 false detections and 3 misses. 1 available position comparison produces an average error of 414 nautical miles.
At the lead time of 14 days (336 hours), there were 1 hit, 0 false detections and 3 misses. 1 available position comparison produces an average error of 421 nautical miles.
At the lead time of 15 days (360 hours), there were 1 hit, 0 false detections and 3 misses. 1 available position comparison produces an average error of 370 nautical miles.
At the lead time of 16 days (384 hours), there were 1 hit, 0 false detections and 2 misses. 2 available position comparisons produce an average error of 459 nautical miles.
At the lead time of 17 days (408 hours), there were 1 hit, 2 false detections and 1 miss. 2 available position comparisons produce an average error of 503 nautical miles.
At the lead time of 18 days (432 hours), there were 0 hits, 3 false detections and 2 misses. 3 available position comparisons produce an average error of 646 nautical miles.
At the lead time of 19 days (456 hours), there were 1 hit, 3 false detections and 1 miss. 2 available position comparisons produce an average error of 667 nautical miles.
At the lead time of 20 days (480 hours), there were 2 hits, 2 false detections and 1 miss. 2 available position comparisons produce an average error of 630 nautical miles.
Circle coloration scheme

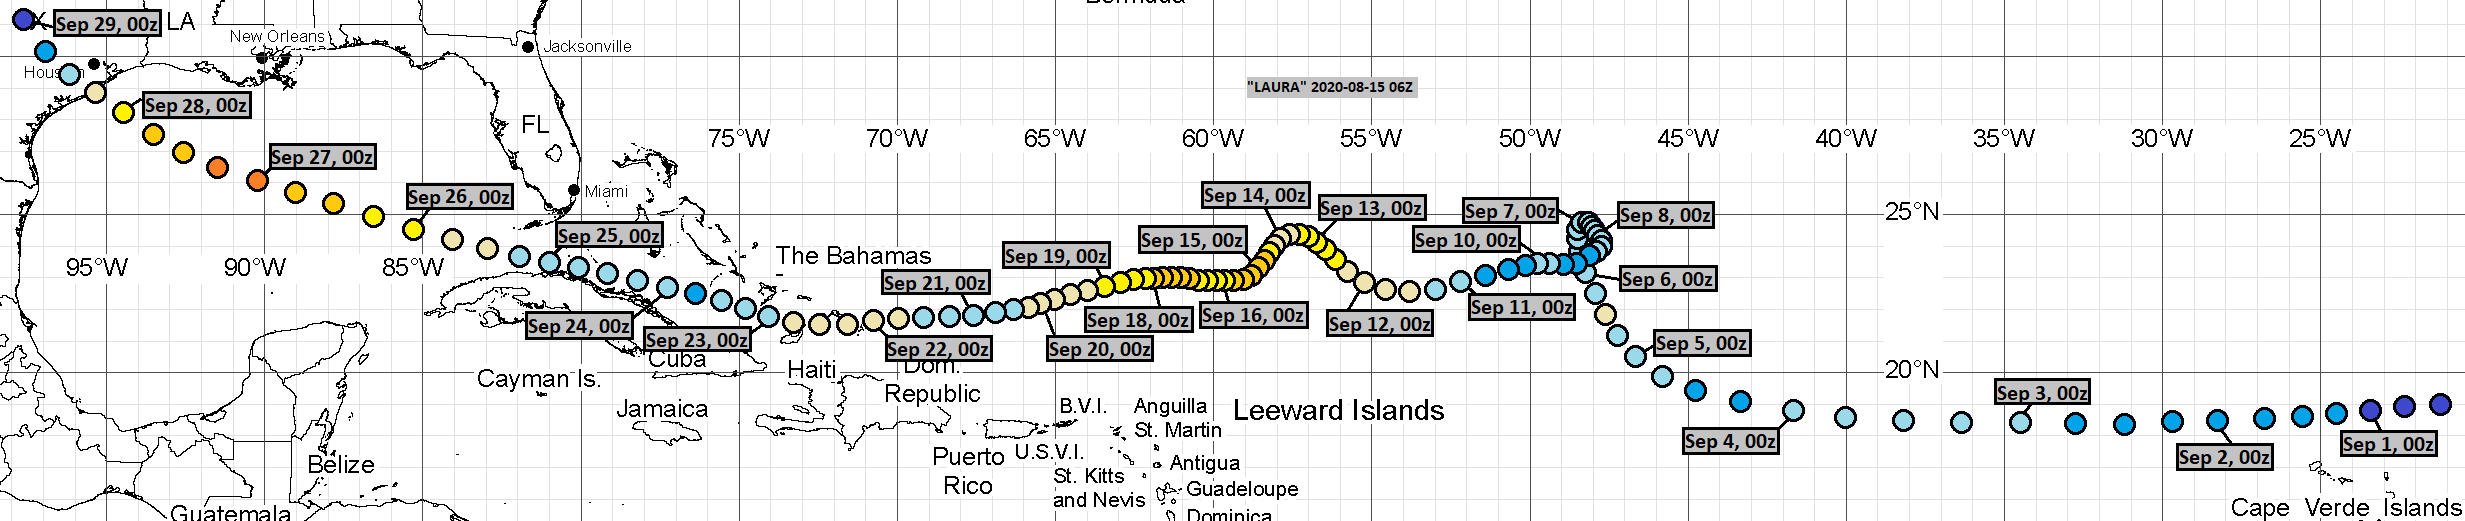
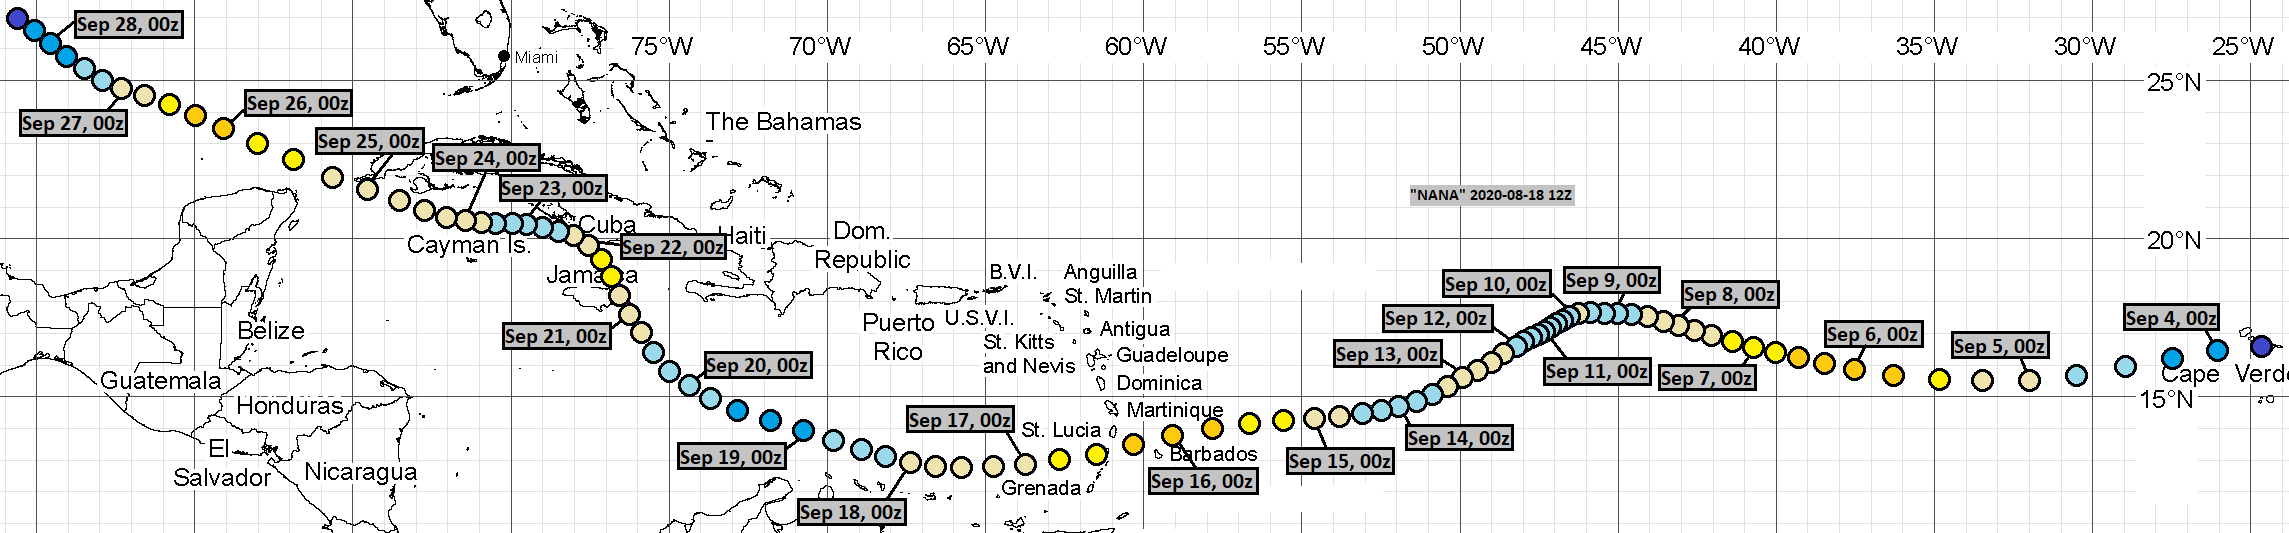
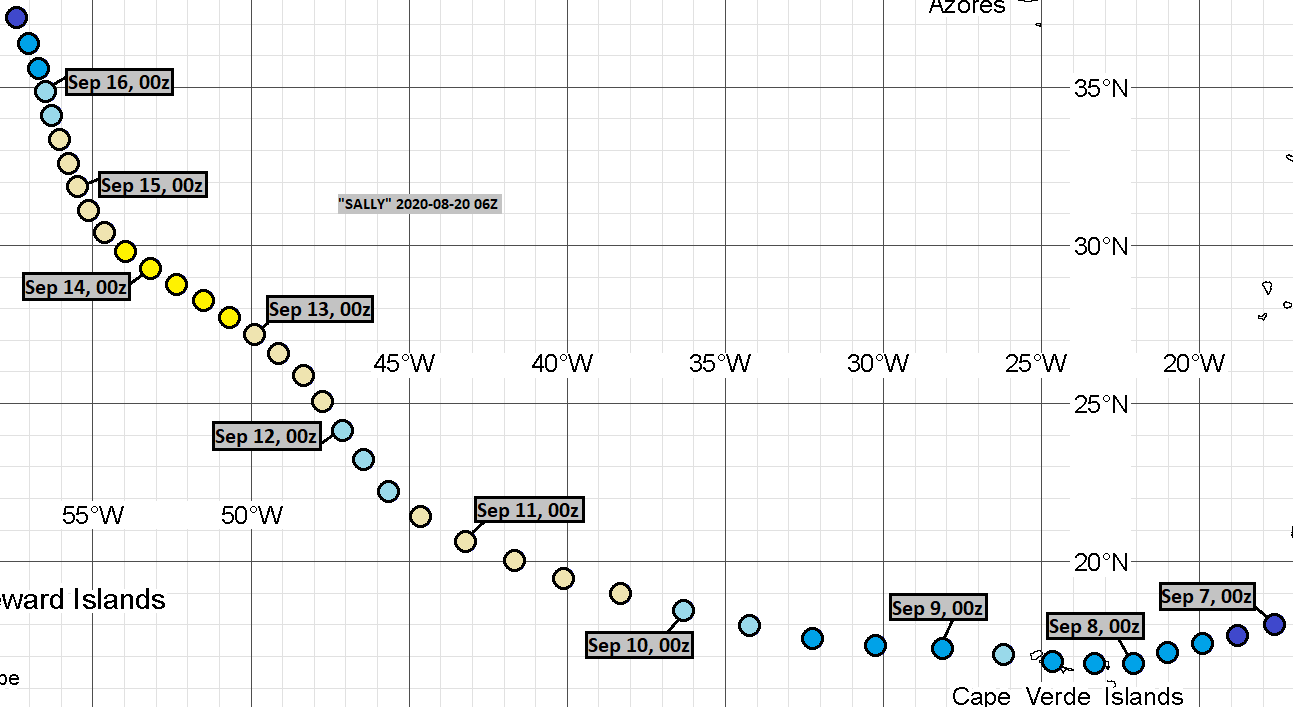
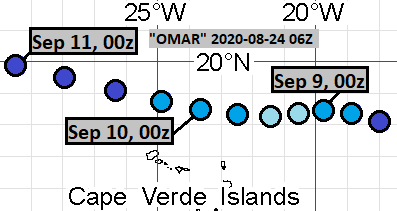
Here are the tracks once again.
August 15, 06Z:
August 18, 12Z:
August 20, 06Z:
August 24, 06Z:
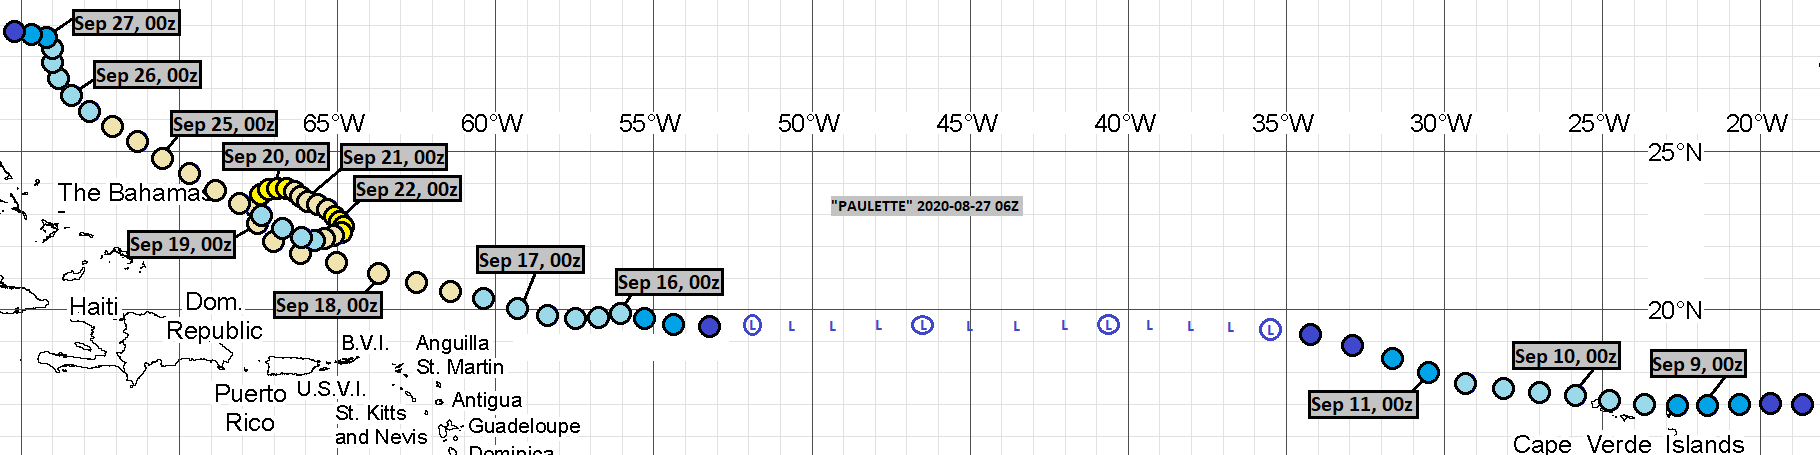
August 27, 06Z:
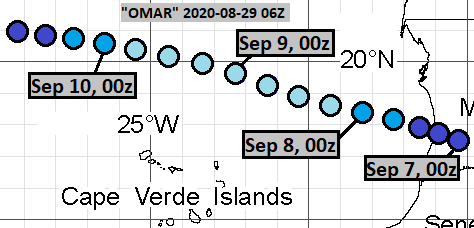
August 29, 06Z:
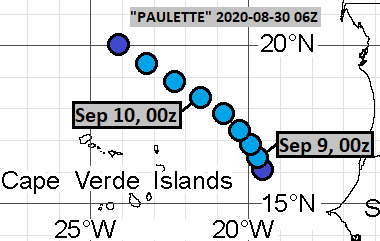
August 30, 06Z:
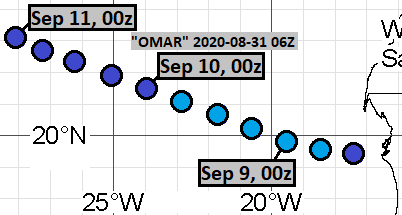
August 31, 06Z:
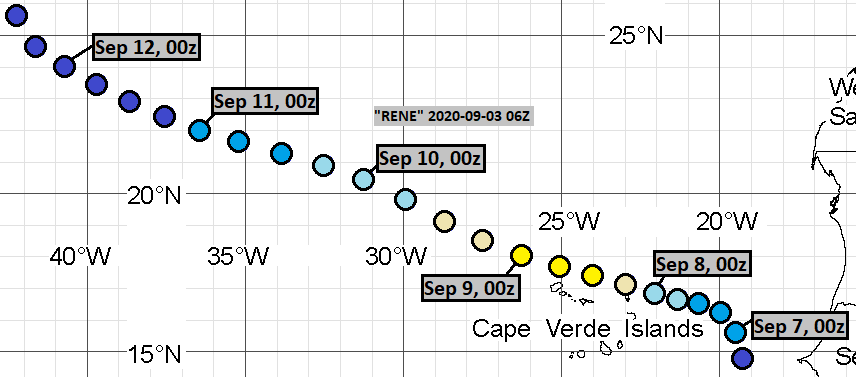
September 3, 06Z:
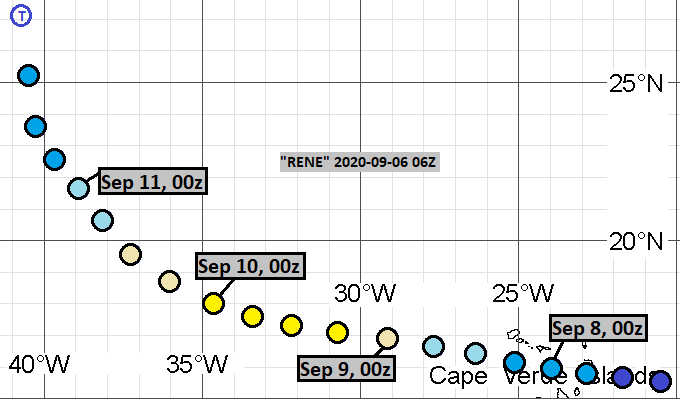
September 6, 06Z:
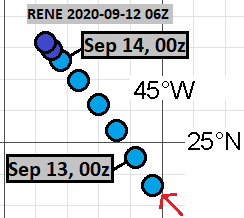
September 12, 06Z:

Comments
Post a Comment