Verification of tracks made of TD 10-E
I made nine tracks of Tropical Depression Ten-E, before it was assessed as
a tropical cyclone. I made one more track after that point.
Additionally, within 480
hours of cyclogenesis, there were ten instances,
when I missed cyclogenesis entirely.
Exiting the margin of East Pacific tracking map through left
edge (about 164 W) is considered equal to dissipation for the purposes
of this verification.
As of this analysis, best track positions are available August 11, 06Z
thru August 17, 18Z, and as such, position comparisons are possible only
for this timespan.
Since I give only SSHS categories in my tracks, I don't
calculate intensity errors in units of speed, but in categories. For
this purpose, I define tropical or subtropical storms as "Category 0", tropical
or subtropical depressions as "Category -1" and non-existence of a tropical or subtropical cyclone as
"Category -2".
In the nine tracks (made before operationally recognized cyclogenesis),
formation times ranged between August 3, 00Z and August 15, 00Z. Average
was August 10, 07Z and median was August 12, 00Z.
In the twenty cases (10 tracks, before the tracks and data agreed, that tropical depression would remain the peak intensity, and 10 complete
misses), peak intensity ranged between Category -2 and Category 5.
Average was Category -0.25 and median was Category -1.
In the ten tracks (made before operationally recognized degeneration
into remnant low), dissipation times ranged between August 11, 00Z
and August 25, 00Z. Average was August 17, 13Z and median was August 18, 15Z.
At the lead time of 1 day (24 hours), there were 2 hits, 0 false detections and 0 misses. 2 available position comparisons produce an average error of 30 nautical miles.
At the lead time of 2 days (48 hours), there were 1 hit, 1 false detection and 0 misses. 2 available position comparisons produce an average error of 91 nautical miles.
At the lead time of 3 days (72 hours), there were 1 hit, 0 false detections and 1 miss. 1 available position comparison produces an average error of 309 nautical miles.
At the lead time of 4 days (96 hours), there were 1 hit, 0 false detections and 2 misses. 1 available position comparison produces an average error of 538 nautical miles.
At the lead time of 5 days (120 hours), there were 0 hits, 0 false detections and 2 misses. No available position comparisons.
At the lead time of 6 days (144 hours), there were 0 hits, 0 false detections and 2 misses. No available position comparisons.
At the lead time of 7 days (168 hours), there were 0 hits, 0 false detections and 3 misses. No available position comparisons.
At the lead time of 8 days (192 hours), there were 0 hits, 0 false detections and 3 misses. No available position comparisons.
At the lead time of 9 days (216 hours), there were 0 hits, 0 false detections and 4 misses. No available position comparisons.
At the lead time of 10 days (240 hours), there were 0 hits, 0 false detections and 3 misses. No available position comparisons.
At the lead time of 11 days (264 hours), there were 0 hits, 0 false detections and 2 misses. No available position comparisons.
At the lead time of 12 days (288 hours), there were 0 hits, 0 false detections and 2 misses. No available position comparisons.
At the lead time of 13 days (312 hours), there were 0 hits, 0 false detections and 3 misses. No available position comparisons.
At the lead time of 14 days (336 hours), there were 0 hits, 0 false detections and 3 misses. No available position comparisons.
At the lead time of 15 days (360 hours), there were 0 hits, 0 false detections and 3 misses. No available position comparisons.
At the lead time of 16 days (384 hours), there were 0 hits, 0 false detections and 3 misses. No available position comparisons.
At the lead time of 17 days (408 hours), there were 3 hits, 5 false detections and 0 misses. 4 available position comparisons produce an average error of 492 nautical miles.
At the lead time of 18 days (432 hours), there were 4 hits, 4 false detections and 0 misses. 4 available position comparisons produce an average error of 355 nautical miles.
At the lead time of 19 days (456 hours), there were 3 hits, 5 false detections and 0 misses. 5 available position comparisons produce an average error of 327 nautical miles.
At the lead time of 20 days (480 hours), there were 2 hits, 6 false detections and 1 miss. 5 available position comparisons produce an average error of 453 nautical miles.
Circle coloration scheme

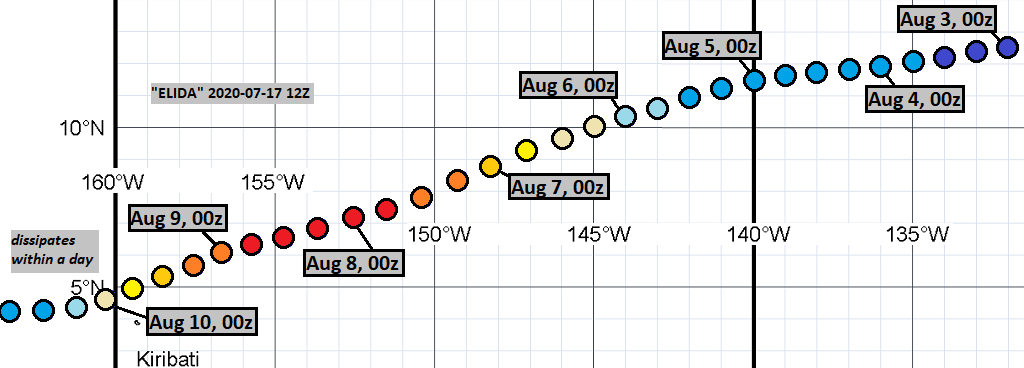
Here are the tracks once again.
July 17, 12Z:
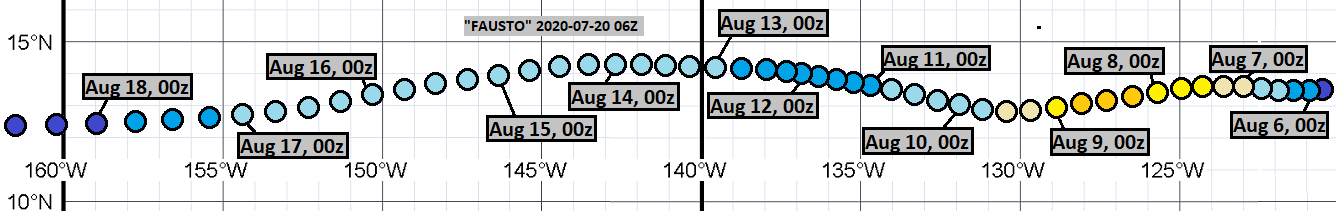
July 20, 06Z:
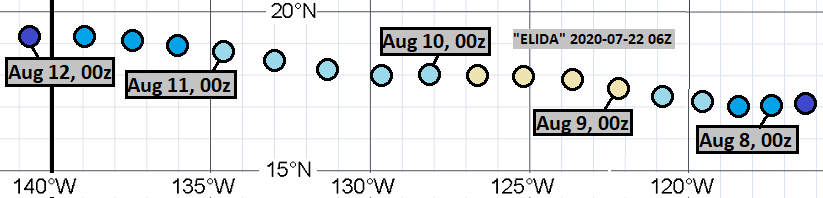
July 22, 06Z:
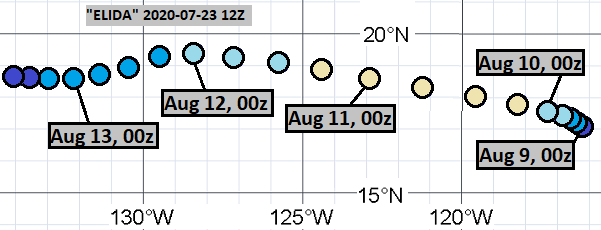
July 23, 12Z:
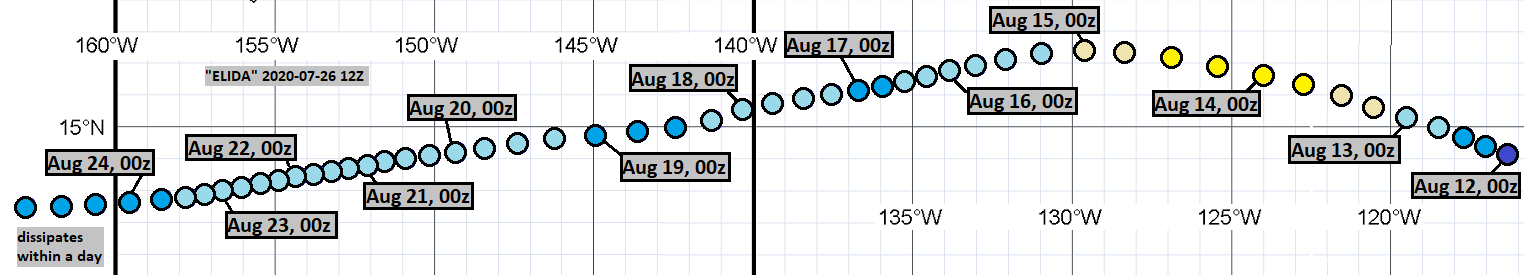
July 26, 12Z:
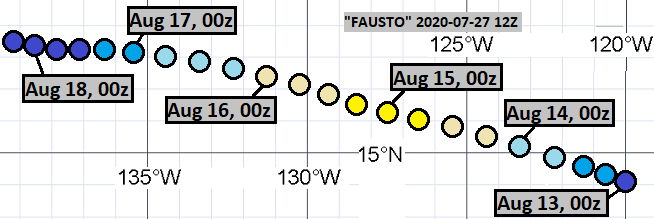
July 27, 12Z:
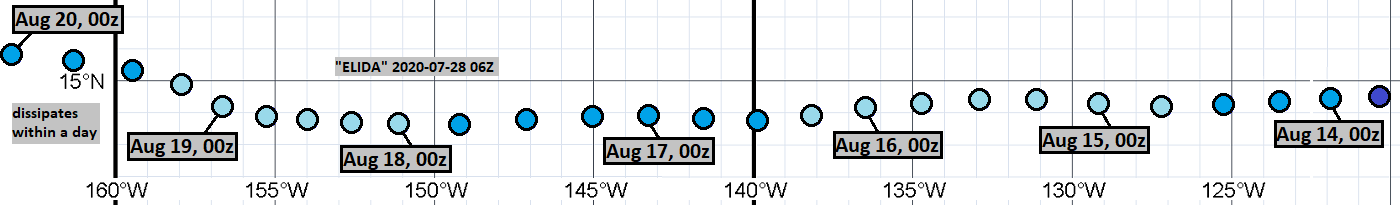
July 28, 06Z:
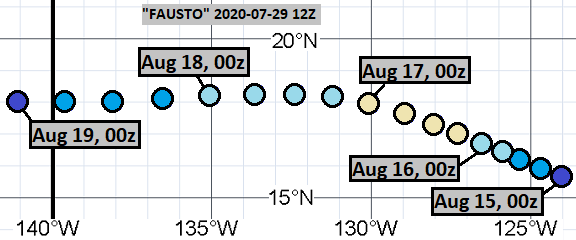
July 29, 12Z:
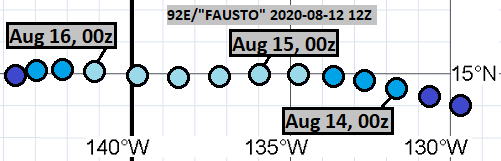
August 12, 12Z:
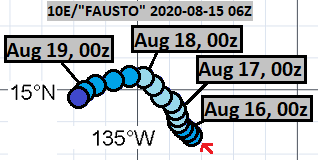
August 15, 06Z:
The complete misses were from the following model cycles:
July 24, 12Z
July 31, 06Z
August 1, 06Z
August 2, 12Z
August 4, 18Z
August 5, 18Z
August 6, 12Z
August 6, 18Z
August 9, 06Z
August 10, 12Z

Comments
Post a Comment