Verification of tracks made of Zeta
I made nineteen tracks of Hurricane Zeta, from eighteen analyses, before it was assessed as
a tropical cyclone. The two tracks from same analysis were not contemporary, and will be hereafter referred to as one track. I made two more tracks after that point. Additionally, within 480
hours of cyclogenesis, there was one instance,
when I missed cyclogenesis entirely. Detection was excellent, even though originally the predicted time of formation was way too early. Position accuracy was great, even though the movement to U.S. Gulf Coast was picked up only at short lead times.
As of this analysis, best track positions are available October 20, 00Z
thru October 29, 18Z, and as such, position comparisons are possible only
for this timespan.
Since I give only SSHS categories in my tracks, I don't
calculate intensity errors in units of speed, but in categories. For
this purpose, I define tropical or subtropical storms as "Category 0", tropical
or subtropical depressions as "Category -1" and non-existence of a tropical or subtropical cyclone as
"Category -2".
In the eighteen tracks (made before operationally recognized cyclogenesis),
formation times ranged between October 11, 00Z and October 25, 00Z. Average
was October 19, 04Z and median was October 20, 12Z.
In the 21 cases (20 tracks, before the tracks and data agreed, that
Category 2 would remain the peak intensity, and 1 complete
miss), peak intensity ranged between Category -2 and Category 5. Average was Category 2.81 and median was Category 3.
In the twenty tracks (made before operationally recognized extratropical
transition), dissipation times ranged between October 15, 00Z
and November 7, 06Z. Average was October 25, 23Z and median was October 26, 00Z.
At the lead time of 1 day (24 hours), there were 3 hits, 0 false detections and 0 misses. 3 available position comparisons produce an average error of 50 nautical miles.
At the lead time of 2 days (48 hours), there were 2 hits, 0 false detections and 0 misses. 2 available position comparisons produce an average error of 74 nautical miles.
At the lead time of 3 days (72 hours), there were 1 hit, 0 false detections and 1 miss. 1 available position comparison produces an average error of 90 nautical miles.
At the lead time of 4 days (96 hours), there were 1 hit, 1 false detection and 1 miss. 2 available position comparisons produce an average error of 85 nautical miles.
At the lead time of 5 days (120 hours), there were 0 hits, 2 false detections and 2 misses. 3 available position comparisons produce an average error of 149 nautical miles.
At the lead time of 6 days (144 hours), there were 0 hits, 4 false detections and 1 miss. 4 available position comparisons produce an average error of 106 nautical miles.
At the lead time of 7 days (168 hours), there were 1 hit, 4 false detections and 1 miss. 5 available position comparisons produce an average error of 159 nautical miles.
At the lead time of 8 days (192 hours), there were 2 hits, 4 false detections and 0 misses. 6 available position comparisons produce an average error of 207 nautical miles.
At the lead time of 9 days (216 hours), there were 3 hits, 5 false detections and 0 misses. 8 available position comparisons produce an average error of 215 nautical miles.
At the lead time of 10 days (240 hours), there were 3 hits, 4 false detections and 1 miss. 7 available position comparisons produce an average error of 272 nautical miles.
At the lead time of 11 days (264 hours), there were 4 hits, 6 false detections and 1 miss. 9 available position comparisons produce an average error of 298 nautical miles.
At the lead time of 12 days (288 hours), there were 5 hits, 5 false detections and 0 misses. 10 available position comparisons produce an average error of 323 nautical miles.
At the lead time of 13 days (312 hours), there were 3 hits, 3 false detections and 3 misses. 6 available position comparisons produce an average error of 333 nautical miles.
At the lead time of 14 days (336 hours), there were 3 hits, 3 false detections and 2 misses. 6 available position comparisons produce an average error of 449 nautical miles.
At the lead time of 15 days (360 hours), there were 0 hits, 3 false detections and 5 misses. 1 available position comparison produces an average error of 490 nautical miles.
At the lead time of 16 days (384 hours), there were 0 hits, 6 false detections and 5 misses. 2 available position comparisons produce an average error of 426 nautical miles.
At the lead time of 17 days (408 hours), there were 0 hits, 7 false detections and 5 misses. 2 available position comparisons produce an average error of 464 nautical miles.
At the lead time of 18 days (432 hours), there were 0 hits, 7 false detections and 3 misses. 2 available position comparisons produce an average error of 460 nautical miles.
At the lead time of 19 days (456 hours), there were 0 hits, 6 false detections and 3 misses. 3 available position comparisons produce an average error of 611 nautical miles.
At the lead time of 20 days (480 hours), there were 0 hits, 6 false detections and 2 misses. 4 available position comparisons produce an average error of 748 nautical miles.
Circle coloration scheme

Here are the tracks once again.
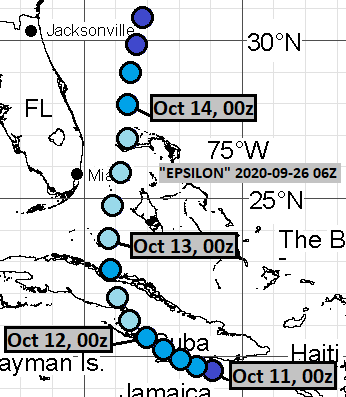
September 26, 06Z:
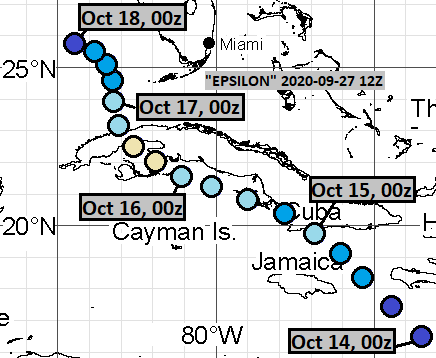
September 27, 12Z:
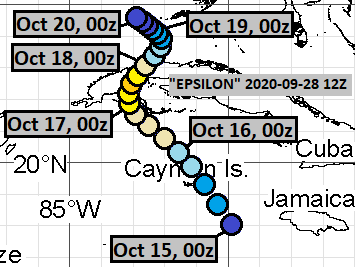
September 28, 12Z:
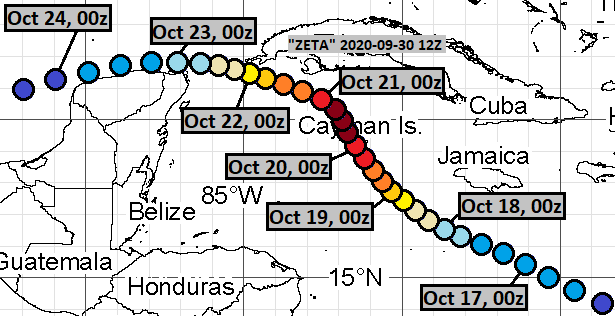
September 30, 12Z:
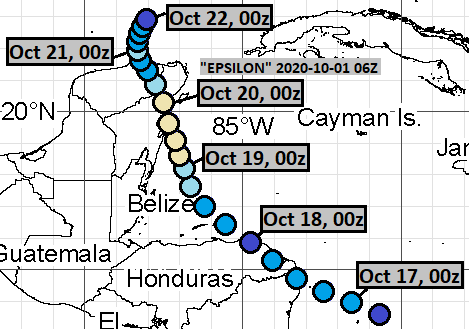
October 1, 06Z:
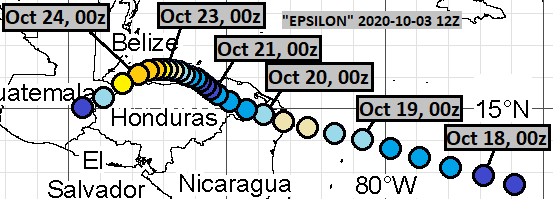
October 3, 12Z:
October 8, 06Z (part 1):
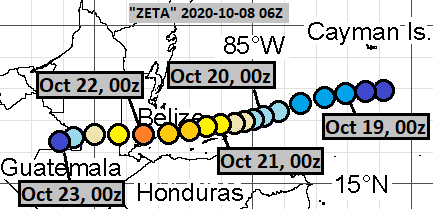
October 8, 06Z (part 2):
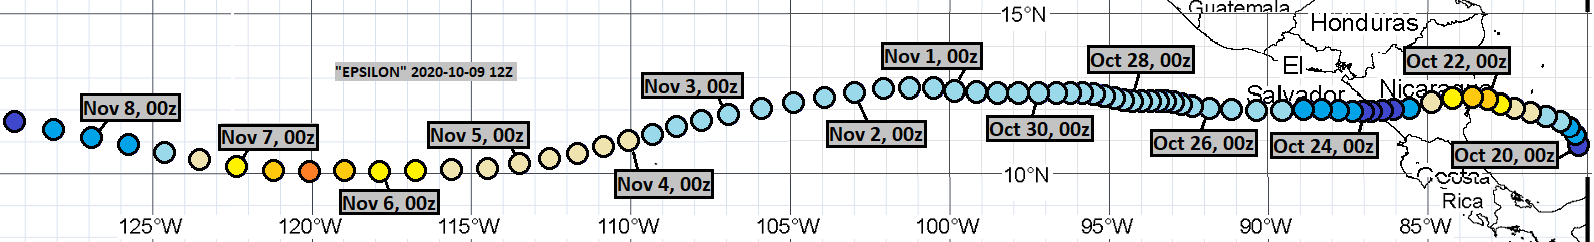
October 9, 12Z:
October 10, 12Z:

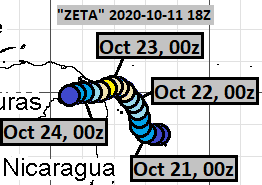
October 11, 18Z:
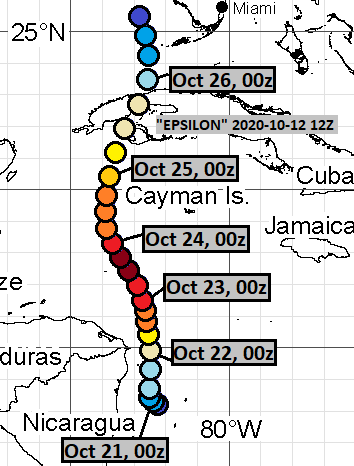
October 12, 12Z:
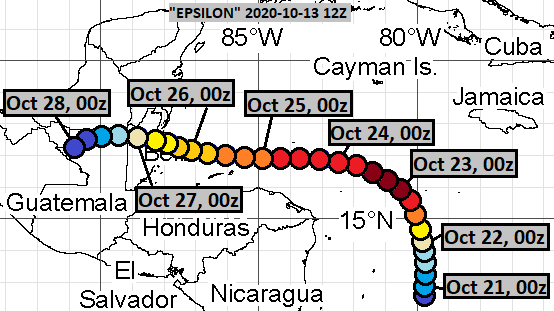
October 13, 12Z:
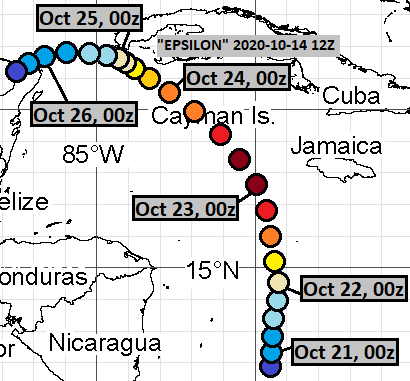
October 14, 12Z:
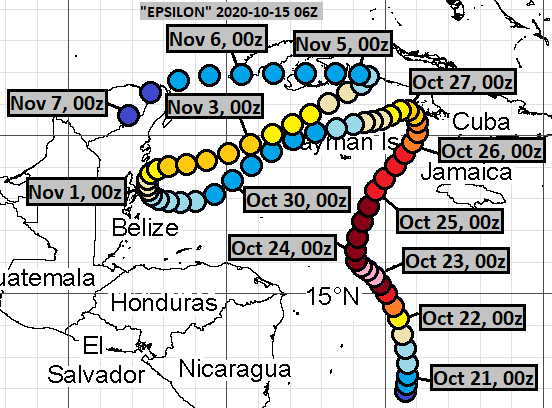
October 15, 06Z:
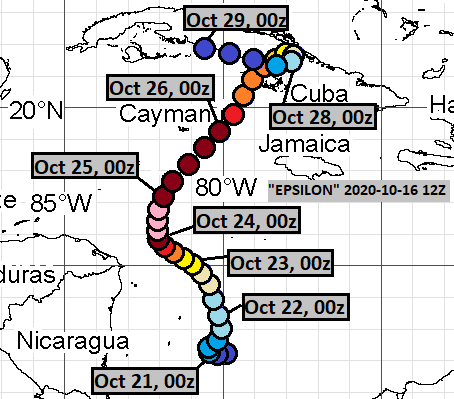
October 16, 12Z:
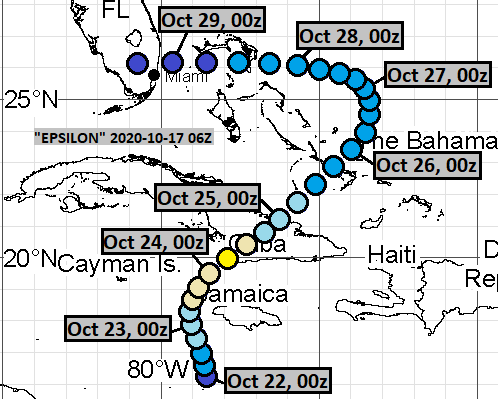
October 17, 06Z:
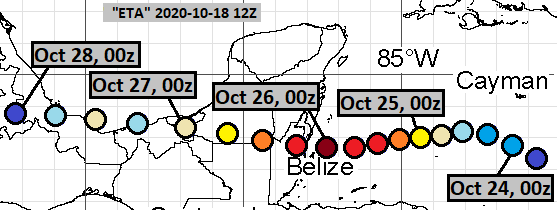
October 18, 12Z:
October 24, 12Z:

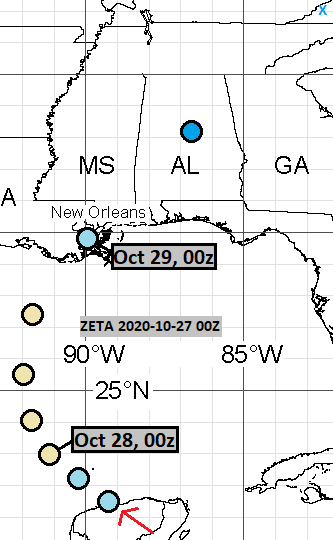
October 27, 00Z:
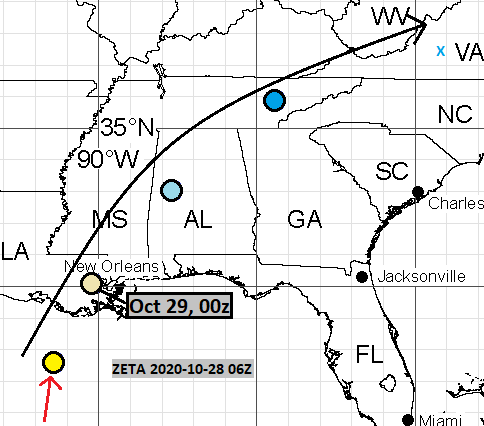
October 28, 06Z:
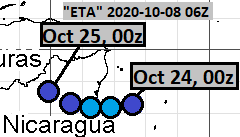
The complete miss was from the following model cycle:
October 22, 12Z

Comments
Post a Comment