Verification of tracks made of Hilda
I made twelve tracks of Hurricane Hilda,
before it was
assessed as
a tropical cyclone. I made three more tracks after cyclogenesis.
Additionally, within 504 hours of cyclogenesis, there were seven instances,
when I missed cyclogenesis entirely.
As of this analysis, best track positions are available July 28, 06Z
thru August 6, 12Z, and as such, position comparisons are possible only
for this timespan.
Since I give only SSHS categories in my tracks, I don't
calculate intensity errors in units of speed, but in categories. For
this purpose, I define tropical or subtropical storms as "Category 0", tropical
or subtropical depressions as "Category -1" and non-existence of a tropical or subtropical cyclone as
"Category -2".
In the twelve tracks (made before operationally recognized
cyclogenesis), formation times ranged between July 26, 12Z and July 31,
00Z. Average was July 28, 17Z and median was July 28, 21Z.
In the nineteen cases (12 tracks, before the tracks and data agreed,
that Category 1 would remain the peak intensity, and 7 complete
misses), peak intensity ranged between Category -2 and Category 5.
Average was Category 0.58 and median was Category 1.
In the fifteen tracks (made before operationally recognized degeneration), dissipation times ranged between July 31, 00Z
and August 6, 12Z. Average was August 3, 06Z and median was August 3, 00Z.
At the lead time of 1 day (24 hours), there were 3 hits, 1 false detection and 1 miss. 4 available position comparisons produce an average error of 37 nautical miles.
At the lead time of 2 days (48 hours), there were 4 hits, 0 false detections and 0 misses. 4 available position comparisons produce an average error of 46 nautical miles.
At the lead time of 3 days (72 hours), there were 3 hits, 0 false detections and 0 misses. 3 available position comparisons produce an average error of 137 nautical miles.
At the lead time of 4 days (96 hours), there were 1 hit, 0 false detections and 4 misses. 2 available position comparisons produce an average error of 182 nautical miles.
At the lead time of 5 days (120 hours), there were 1 hit, 0 false detections and 4 misses. 1 available position comparison produces an average error of 382 nautical miles.
At the lead time of 6 days (144 hours), there were 1 hit, 2 false detections and 5 misses. 3 available position comparisons produce an average error of 236 nautical miles.
At the lead time of 7 days (168 hours), there were 1 hit, 3 false detections and 6 misses. 3 available position comparisons produce an average error of 293 nautical miles.
At the lead time of 8 days (192 hours), there were 1 hit, 3 false detections and 6 misses. 4 available position comparisons produce an average error of 130 nautical miles.
At the lead time of 9 days (216 hours), there were 2 hits, 2 false detections and 6 misses. 4 available position comparisons produce an average error of 198 nautical miles.
At the lead time of 10 days (240 hours), there were 2 hits, 1 false detection and 5 misses. 3 available position comparisons produce an average error of 306 nautical miles.
At the lead time of 11 days (264 hours), there were 2 hit, 1 false detection and 5 misses. 3 available position comparisons produce an average error of 257 nautical miles.
At the lead time of 12 days (288 hours), there were 2 hits, 1 false detection and 5 misses. 3 available position comparisons produce an average error of 222 nautical miles.
At the lead time of 13 days (312 hours), there were 1 hit, 2 false detections and 5 misses. 2 available position comparisons produce an average error of 251 nautical miles.
At the lead time of 14 days (336 hours), there were 1 hit, 2 false detections and 5 misses. 2 available position comparisons produce an average error of 284 nautical miles.
At the lead time of 15 days (360 hours), there were 1 hit, 3 false detections and 3 misses. 3 available position comparisons produce an average error of 372 nautical miles.
At the lead time of 16 days (384 hours), there were 1 hit, 2 false detections and 3 misses. 2 available position comparisons produce an average error of 394 nautical miles.
At the lead time of 17 days (408 hours), there were 1 hit, 3 false detections and 2 misses. 4 available position comparisons produce an average error of 543 nautical miles.
At the lead time of 18 days (432 hours), there were 1 hit, 2 false detections and 2 misses. 3 available position comparisons produce an average error of 511 nautical miles.
At the lead time of 19 days (456 hours), there were 1 hit, 1 false detection and 3 misses. 2 available position comparisons produce an average error of 404 nautical miles.
At the lead time of 20 days (480 hours), there were 1 hit, 0 false detections and 3 misses. 1 available position comparison produces an average error of 178 nautical miles.
At the lead time of 21 days (504 hours), there were 1 hit, 0 false detections and 4 misses. 1 available position comparison produces an average error of 177 nautical miles.
Circle coloration scheme

Here are the tracks once again.
July 11, 12Z:

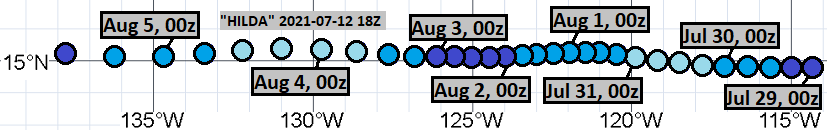
July 12, 18Z:
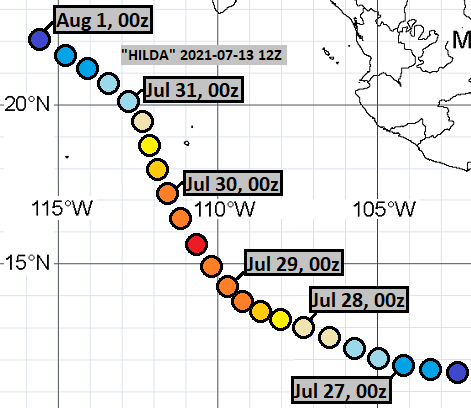
July 13, 12Z:
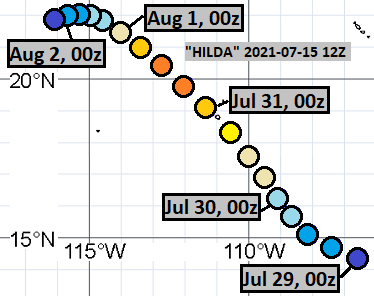
July 15, 12Z:
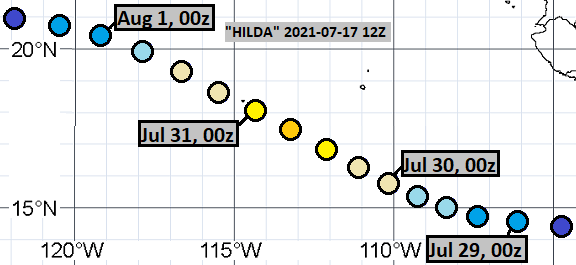
July 17, 12Z:
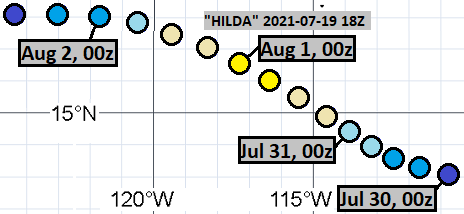
July 19, 18Z:
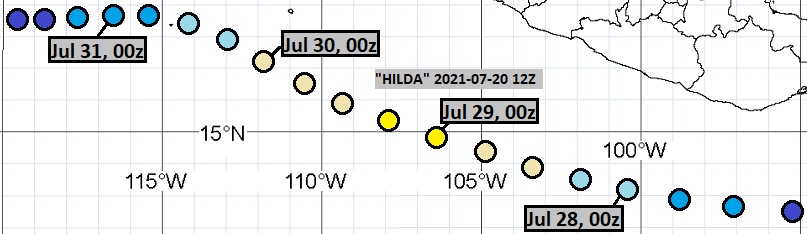
July 20, 12Z:
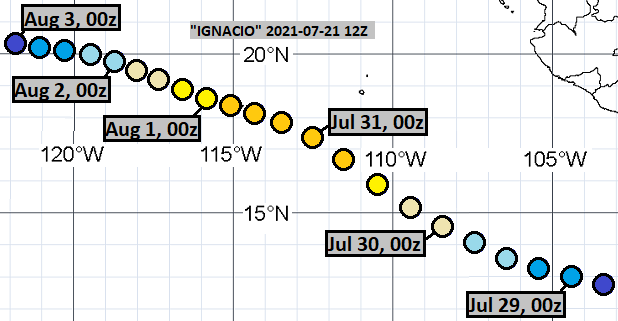
July 21, 12Z:
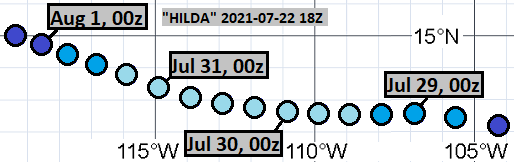
July 22, 18Z:
July 23, 06Z:

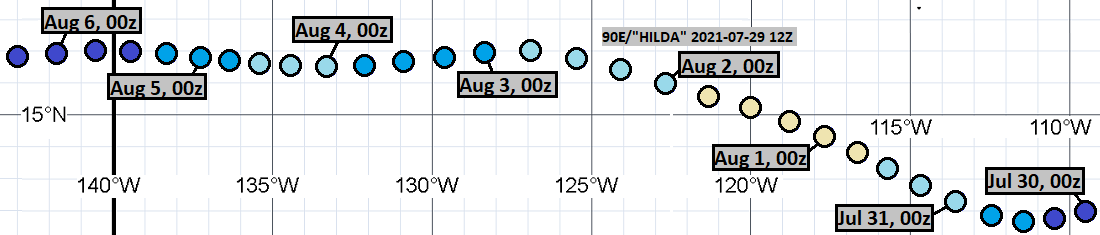
July 29, 12Z:
July 30, 12Z:

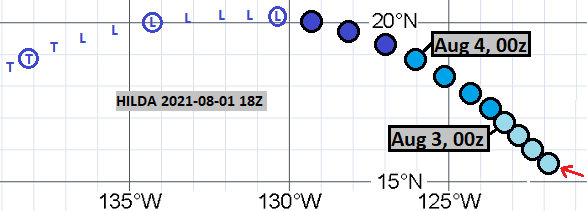
August 1, 18Z:
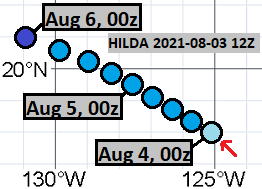
August 3, 12Z:
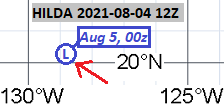
August 4, 12Z:
The complete misses were from the following model cycles:
July 10, 18Z
July 24, 00Z
July 24, 18Z
July 25, 12Z
July 26, 18Z
July 27, 12Z
July 27, 18Z
Comments
Post a Comment