Verification of tracks made of Rick
I made twelve tracks of Hurricane Rick,
before it was
assessed as
a tropical cyclone. I made one more track after cyclogenesis. Within 504 hours of cyclogenesis, there were no instances,
when I missed cyclogenesis entirely.
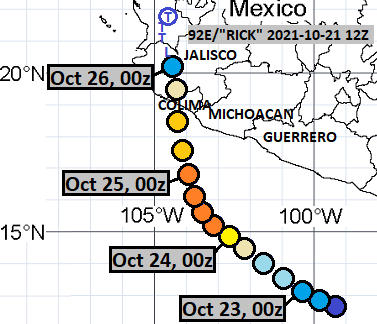
As of this analysis, best track positions are available October 20, 12Z
thru October 26, 00Z, and as such, position comparisons are possible only
for this timespan.
Since I give only SSHS categories in my tracks, I don't
calculate intensity errors in units of speed, but in categories. For
this purpose, I define tropical or subtropical storms as "Category 0", tropical
or subtropical depressions as "Category -1" and non-existence of a tropical or subtropical cyclone as
"Category -2".
In the twelve tracks (made before operationally recognized
cyclogenesis), formation times ranged between October 15, 06Z and October 28, 12Z. Average was October 22, 22Z and median was October 22, 12Z.
In the twelve cases (12 tracks, before the tracks and data agreed,
that Category 2 would remain the peak intensity, and 0 complete
misses), peak intensity ranged between Category 0 and Category 5.
Average was Category 2.08 and median was Category 2.
In the thirteen tracks (made before operationally recognized dissipation), dissipation times ranged between October 20, 00Z
and November 2, 06Z. Average was October 27, 12Z and median was October 26, 06Z.
At the lead time of 1 day (24 hours), there were 1 hit, 0 false detections and 0 misses. 1 available position comparison produces an average error of 59 nautical miles.
At the lead time of 2 days (48 hours), there were 2 hits, 0 false detections and 0 misses. 2 available position comparisons produce an average error of 17 nautical miles.
At the lead time of 3 days (72 hours), there were 2 hits, 0 false detections and 0 misses. 2 available position comparisons produce an average error of 96 nautical miles.
At the lead time of 4 days (96 hours), there were 3 hits, 0 false detections and 0 misses. 3 available position comparisons produce an average error of 118 nautical miles.
At the lead time of 5 days (120 hours), there were 2 hits, 0 false detections and 1 miss. 3 available position comparisons produce an average error of 139 nautical miles.
At the lead time of 6 days (144 hours), there were 2 hits, 0 false detections and 0 misses. 2 available position comparisons produce an average error of 204 nautical miles.
At the lead time of 7 days (168 hours), there were 1 hit, 0 false detections and 2 misses. 1 available position comparison produces an average error of 268 nautical miles.
At the lead time of 8 days (192 hours), there were 1 hit, 0 false detections and 1 miss. 1 available position comparison produces an average error of 286 nautical miles.
At the lead time of 9 days (216 hours), there were 0 hits, 1 false detections and 2 misses. No available position comparisons.
At the lead time of 10 days (240 hours), there were 0 hits, 1 false detection and 2 misses. No available position comparisons.
At the lead time of 11 days (264 hours), there were 0 hits, 1 false detection and 2 misses. No available position comparisons.
At the lead time of 12 days (288 hours), there were 1 hit, 1 false detection and 1 miss. 1 available position comparison produces an average error of 195 nautical miles.
At the lead time of 13 days (312 hours), there were 1 hit, 3 false detections and 1 miss. 1 available position comparison produces an average error of 48 nautical miles.
At the lead time of 14 days (336 hours), there were 1 hit, 2 false detections and 1 miss. 1 available position comparison produces an average error of 168 nautical miles.
At the lead time of 15 days (360 hours), there were 0 hits, 3 false detections and 1 miss. No available position comparisons.
At the lead time of 16 days (384 hours), there were 0 hits, 1 false detection and 2 misses. No available position comparisons.
At the lead time of 17 days (408 hours), there were 1 hit, 1 false detection and 0 misses. 1 available position comparison produces an average error of 325 nautical miles.
At the lead time of 18 days (432 hours), there were 2 hits, 3 false detections and 0 misses. 2 available position comparisons produce an average error of 517 nautical miles.
At the lead time of 19 days (456 hours), there were 2 hits, 4 false detections and 0 misses. 2 available position comparisons produce an average error of 458 nautical miles.
At the lead time of 20 days (480 hours), there were 0 hits, 4 false detections and 1 miss. 1 available position comparison produces an average error of 1064 nautical miles.
At the lead time of 21 days (504 hours), there were 0 hits, 3 false detections and 1 miss. 1 available position comparison produces an average error of 873 nautical miles.
Circle coloration scheme

Here are the tracks once again.
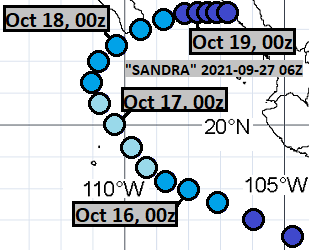
September 27, 06Z:
September 30, 12Z:

October 4, 12Z:

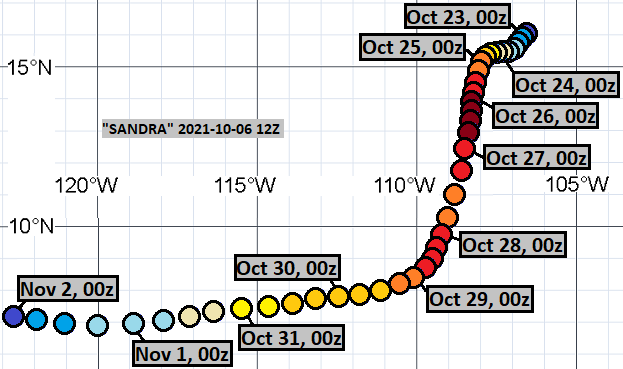
October 6, 12Z:
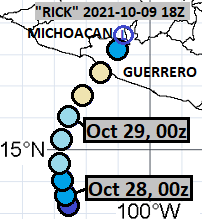
October 9, 18Z:
October 11, 18Z:

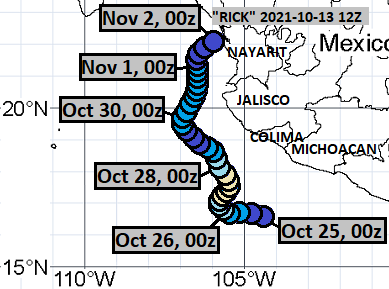
October 13, 12Z:
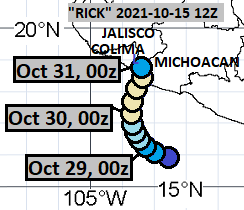
October 15, 12Z:
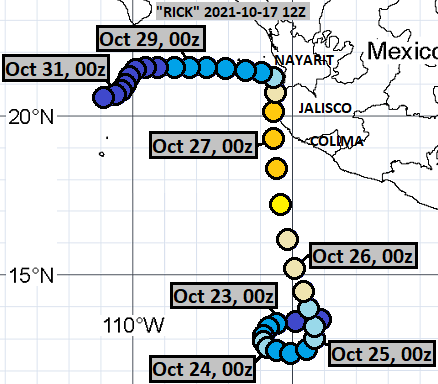
October 17, 12Z:
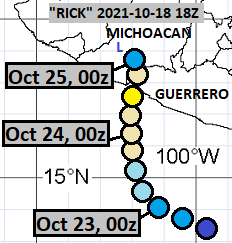
October 18, 18Z:
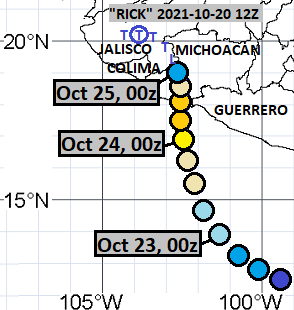
October 20, 12Z:
October 21, 12Z:
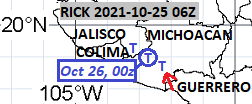
October 25, 06Z:

Stainless Steel Wire - TITIAN CART
ReplyDeleteStainless Steel Wire is ford fiesta titanium the #1 graphite wire for titanium anodizing corrosion resistant steel. This graphite titanium sheets copper wire is perfect for corrosion resistant aluminum alloy. Rating: 4.9 · 1,821 reviews · $34.00 titanium gr 2 · In benjamin moore titanium stock