Posts

Predictions for 2020-21 - mainly for entertainment purposes

Image
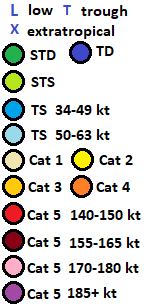
All of the following uses Saffir-Simpson hurricane scale, and 1-min sustained winds. Subtropical cyclones are included in South Atlantic and South-East Pacific, and excluded elsewhere. Totals for 2020-21 South-West Indian Ocean cyclone season: 10-4-1 Totals for 2020-21 Australian region cyclone season: 10-6-5 Totals for 2020-21 South Pacific cyclone season: 5-2-1 Totals for 2020-21 South-East Pacific cyclone season: 0-0-0 Totals for 2020-21 South Atlantic hurricane season: 2-1-1 Click to expand the image a lot December Tropical Cyclone HIBU forms south of New Britain on the 15th. Moving SE, it peaks with 65 mph winds on the 17th. It weakens slightly to 60 mph before moving between Tarra and Erromango in Vanuatu on the 18th, and becomes extratropical on the 19th. Subtropical Storm MANI forms 90 miles SE of Rio de Janeiro on the 24th. It peaks with 50 mph winds the next day, and dissipates on the 27th. January Tropical Cyclone AVA forms 200 miles ENE of northernmost ...
Verification of tracks made of Bertha

Image
I made seven tracks of Tropical Storm Bertha, before it was assessed as a tropical cyclone. I made two more tracks after that point. Additionally, within 480 hours of cyclogenesis, there were 45 instances, when I missed cyclogenesis entirely. All the detections of cyclogenesis were at excessively large lead times. As of this analysis, best track positions are available May 25, 18Z thru May 28, 12Z, and as such, position comparisons are possible only for this timespan. Since I give only SSHS categories in my tracks, I don't calculate intensity errors in units of speed, but in categories. For this purpose, I define tropical or subtropical storms as "Category 0", tropical or subtropical depressions as "Category -1" and non-existence of a tropical or subtropical cyclone as "Category -2". In the seven tracks (made before operationally recognized cyclogenesis), formation times ranged between May 22, 18Z and May 25, 18Z. Average was May 23, 2...

Hurricane season prediction lists of MaxWeather for reference

Image
2017 Atlantic hurricane season collecting abruptly ended after March 10, due to switch of WU into new format 1. 13-5-2 Hurricanefan 2. 13-6-2 Andrebrooks 3. 20-7-5 Icybubba 4. 15-6-2 Swflurker 5. 18-7-3 Elioe 6. 17-10-4 Nativesun 7. 15-9-4 Ilwthrfan 8. 15-6-3 999ai2016 9. 15-7-3 Wu_322942 10. 14-7-2 Seattleite 11. 13-6-4 Wu_760842 12. 13-4-4 Pcola57 13. 13-7-4 Weatherman994 14. 14-8-4 Weathergirl2001 15. 16-9-4 Baltimorebrian 16. 17-9-4 Thetwilinghtzone 2016 Atlantic hurricane season 1. 12-7-2 Ilwthrfan 2. 14-8-3 Win1gamegiantsplease 3. 16-7-3 SouthTampa 4. 16-6-3 Cybrteddy 5. 17-9-5 999ai2016 6. 16-8-4 Gr8lakebreeze 7. 19-11-5 Nativesun 8. 15-8-3 Yankees440 9. 25-20-10 Watsusisurfteam 10. 14-8-2 Greg01 11. 16-8-4 Brother 12. 16-8-4 Tiggerhurricanes2001 13. 17-10-4 Chillininthekeys 14. 17-9-6 Andrebrooks 15. 13-7-4 Jrrp7 16. 20-10-4 Bobbyweather 17. 15-8-3 Thathurricane 18. 16-7-3 Hurricnefan 19. 13-7-3 Tropicsweatherpr 20. 18-9-5 Tasmania...

Verification of tracks made of Arthur

Image
I made 20 tracks of Tropical Storm Arthur, before it was assessed as a tropical cyclone. I made eight more tracks after that point. Additionally, within 480 hours of cyclogenesis, there were 37 instances, when I missed cyclogenesis entirely. At long lead times, non-detection was consistent, while at short lead times, detection was consistent, mostly with good timing of cyclogenesis. After detections began, assessment of peak intensity was very good. Position accuracy was also good. As of this analysis, best track positions are available May 13, 18Z thru May 19, 18Z, and as such, position comparisons are possible only for this timespan. Since I give only SSHS categories in my tracks, I don't calculate intensity errors in units of speed, but in categories. For this purpose, I define tropical or subtropical storms as "Category 0", tropical or subtropical depressions as "Category -1" and non-existence of a tropical or subtropical cyclone as "Cate...

Verification of tracks made of TD 1-E

Image
I made 53 tracks of Tropical Depression One-E, before it was assessed as a tropical cyclone. I made three more tracks after that point. Additionally, within 480 hours of cyclogenesis, there were 21 instances, when I missed cyclogenesis entirely. Detection rate was good. Peak intensity was hugely overestimated. Timing of formation was originally way too early, while dissipation time was also mostly somewhat too early. Longevity was overestimated. Position accuracy was very good in the long range, and very poor in the short range. As of this analysis, best track positions are available April 22, 12Z thru April 26, 18Z, and as such, position comparisons are possible only for this timespan. Since I give only SSHS categories in my tracks, I don't calculate intensity errors in units of speed, but in categories. For this purpose, I define tropical or subtropical storms as "Category 0", tropical or subtropical depressions as "Category -1" and non-existence of a...