Verification of Atlantic ghost storm tracks of January-May 2019
I falsely detected (sub)tropical cyclogenesis in Atlantic (north of equator and west of Greenwich) 134 times in January thru May of 2019. Additionally, false East Pacific cyclogeneses led to crossover into the basin 10 times, and false Gulf of Guinea cyclogeneses led to crossover into the basin 4 times. Tracks were made of 28 systems.
In the calculations, crossover into East Pacific as a tropical cyclone is considered equal to dissipation, and crossover from East Pacific or Gulf of Guinea as a tropical cyclone is considered equal to formation or regeneration.
At the lead time of 1 day (24 hours), there were 0 false detections.
At the lead time of 2 days (48 hours), there were 1 false detections.
At the lead time of 3 days (72 hours), there were 1 false detections.
At the lead time of 4 days (96 hours), there were 7 false detections.
At the lead time of 5 days (120 hours), there were 18 false detections.
At the lead time of 6 days (144 hours), there were 18 false detections.
At the lead time of 7 days (168 hours), there were 20 false detections.
At the lead time of 8 days (192 hours), there were 17 false detections.
At the lead time of 9 days (216 hours), there were 17 false detections.
At the lead time of 10 days (240 hours), there were 21 false detections.
At the lead time of 11 days (264 hours), there were 31 false detections.
At the lead time of 12 days (288 hours), there were 40 false detections.
At the lead time of 13 days (312 hours), there were 38 false detections.
At the lead time of 14 days (336 hours), there were 44 false detections.
At the lead time of 15 days (360 hours), there were 43 false detections.
At the lead time of 16 days (384 hours), there were 57 false detections.
May 22, 18Z run:
In the calculations, crossover into East Pacific as a tropical cyclone is considered equal to dissipation, and crossover from East Pacific or Gulf of Guinea as a tropical cyclone is considered equal to formation or regeneration.
At the lead time of 1 day (24 hours), there were 0 false detections.
At the lead time of 2 days (48 hours), there were 1 false detections.
At the lead time of 3 days (72 hours), there were 1 false detections.
At the lead time of 4 days (96 hours), there were 7 false detections.
At the lead time of 5 days (120 hours), there were 18 false detections.
At the lead time of 6 days (144 hours), there were 18 false detections.
At the lead time of 7 days (168 hours), there were 20 false detections.
At the lead time of 8 days (192 hours), there were 17 false detections.
At the lead time of 9 days (216 hours), there were 17 false detections.
At the lead time of 10 days (240 hours), there were 21 false detections.
At the lead time of 11 days (264 hours), there were 31 false detections.
At the lead time of 12 days (288 hours), there were 40 false detections.
At the lead time of 13 days (312 hours), there were 38 false detections.
At the lead time of 14 days (336 hours), there were 44 false detections.
At the lead time of 15 days (360 hours), there were 43 false detections.
At the lead time of 16 days (384 hours), there were 57 false detections.
Ghost storm L#01
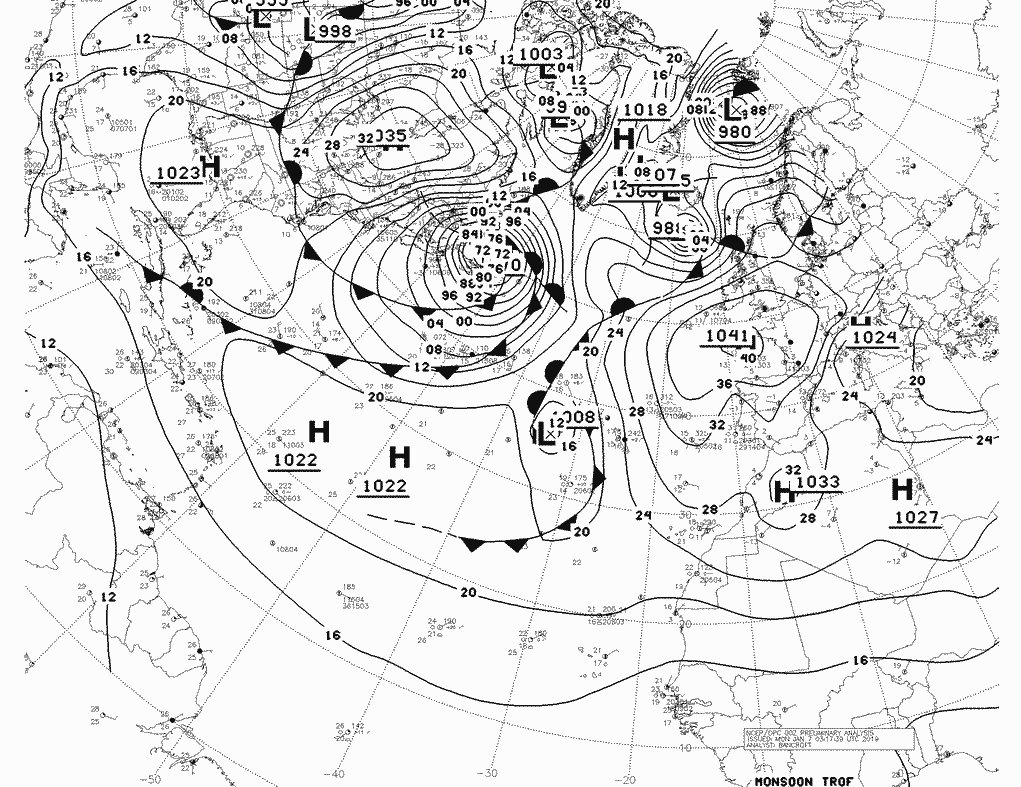
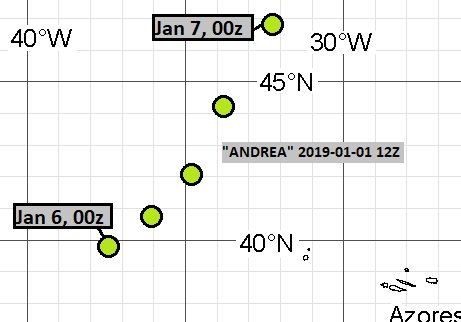
This is best identifiable with a low with 1008 mbar near Azores in this synoptic chart.
January 1, 12Z run:
January 3, 18Z run:
Ghost storm L#02
This isolated incident is best identifiable with the 1018 mbar low well north of Leeward Islands in this synoptic chart.
January 2, 12Z run:
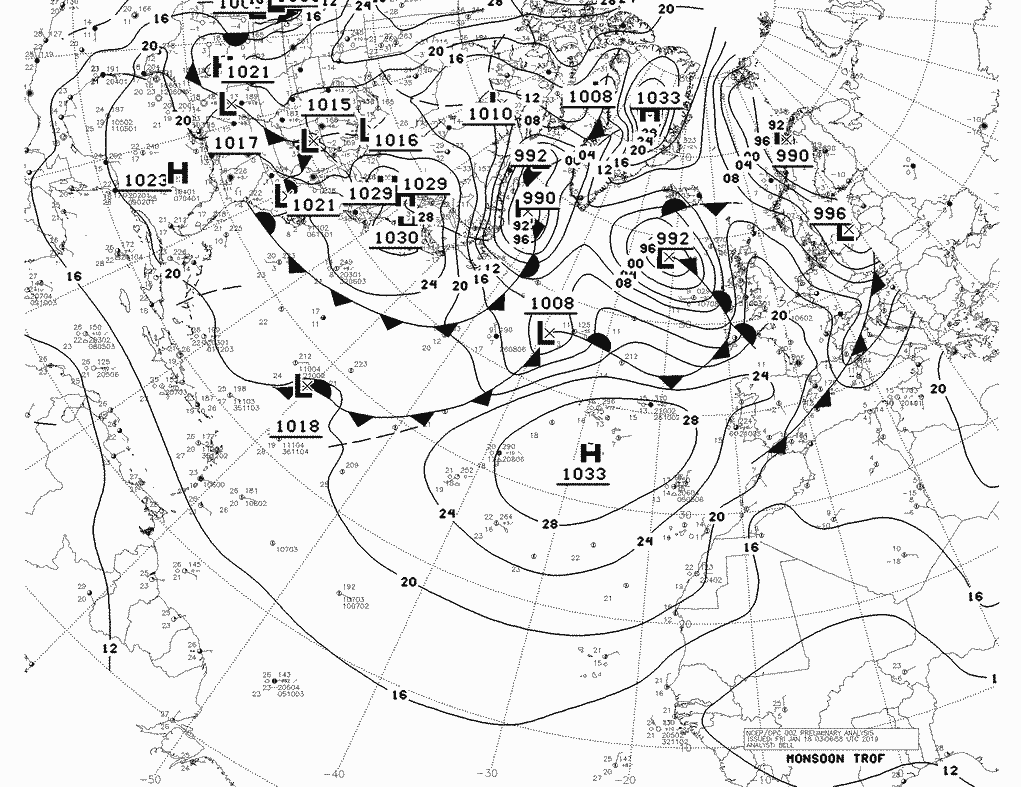
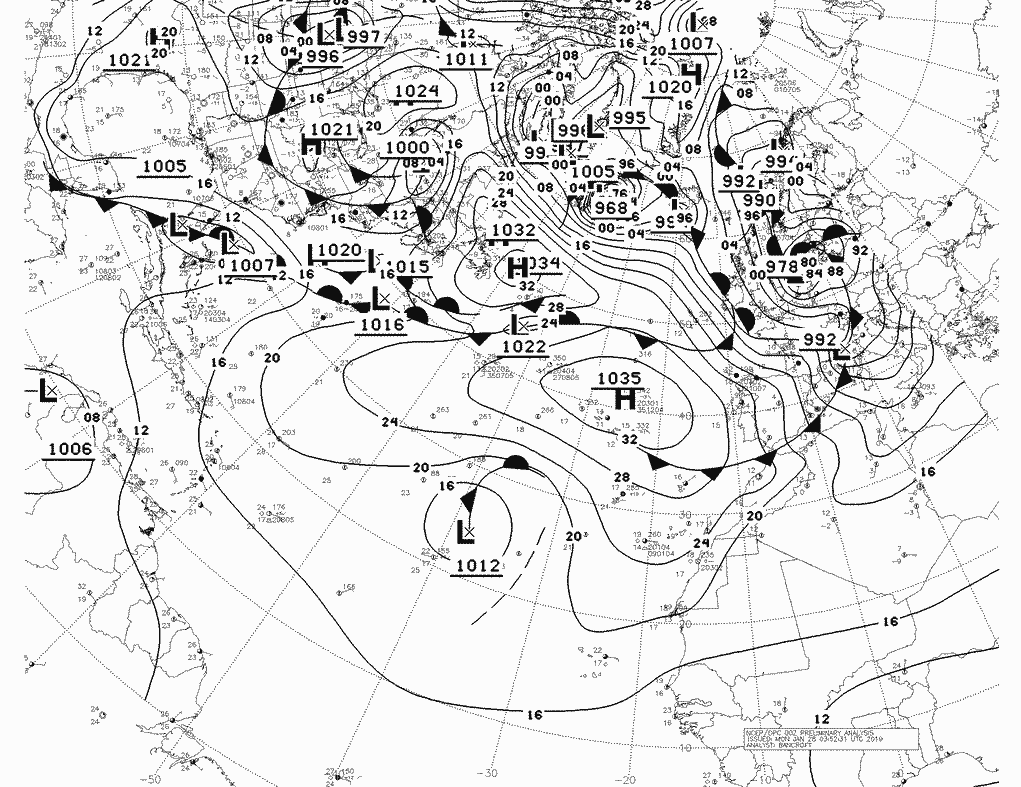
Ghost storm L#03
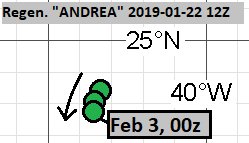
This system is the 1012 mbar low in Central Atlantic in this chart.
January 19, 12Z run:
January 20, 00Z run:
January 20, 06Z run:
January 20, 12Z run:
January 21, 06Z run:
January 21, 12Z run:
January 22, 12Z run:
January 23, 06Z run:
January 24, 00Z run:
January 24, 06Z run:
January 24, 12Z run:
January 24, 18Z run:
January 25, 00Z run:
January 25, 06Z run:
Ghost storm L#04
This was same system as L#03, but with a later window of subtropical transition or regeneration.
January 22, 12Z run:
January 23, 12Z run:
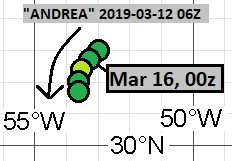
Ghost storm L#05
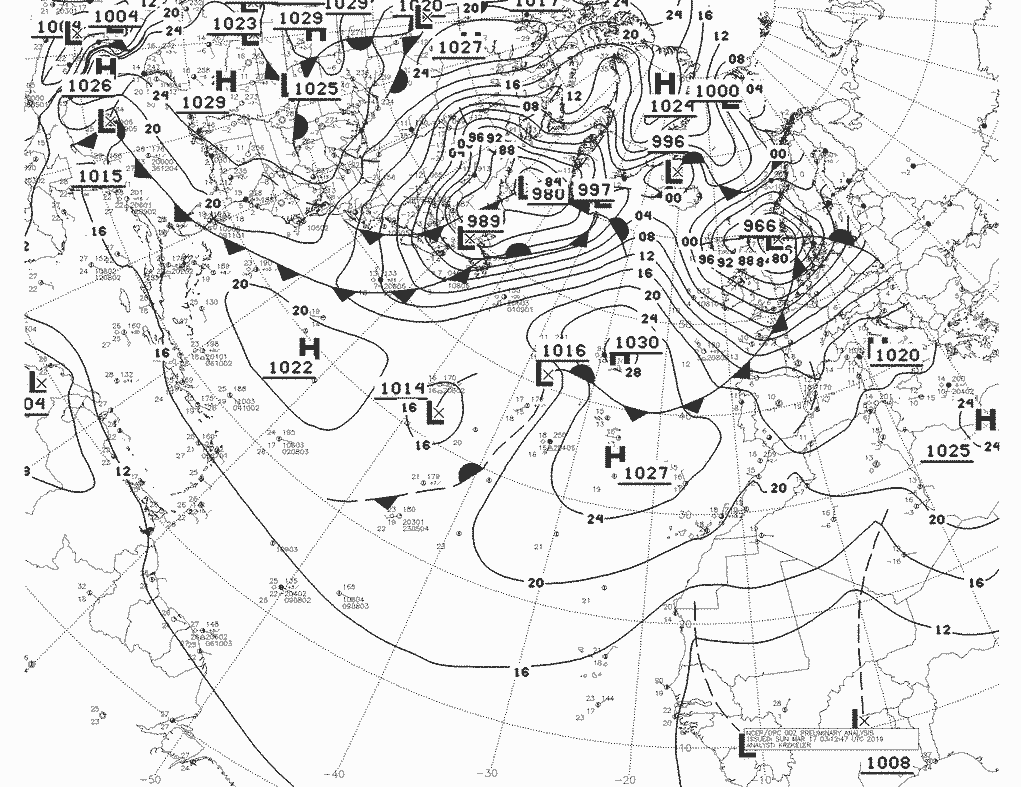
This is best identifiable with the detached 1014 mbar low in Central Atlantic in this synoptic chart.
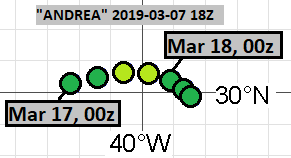
March 7, 18Z run:
March 11, 12Z run:
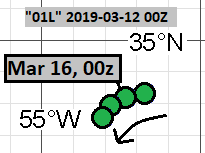
March 12, 00Z run:
March 12, 06Z run:
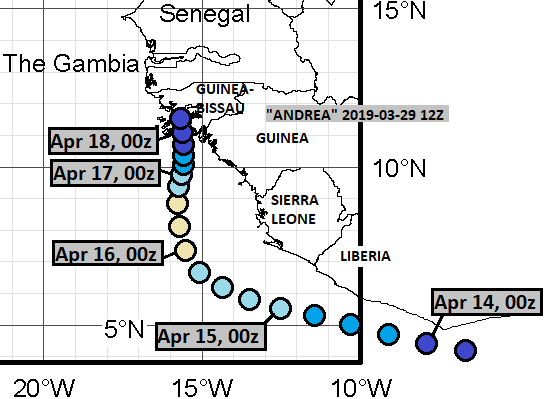
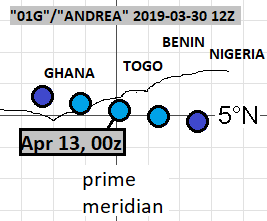
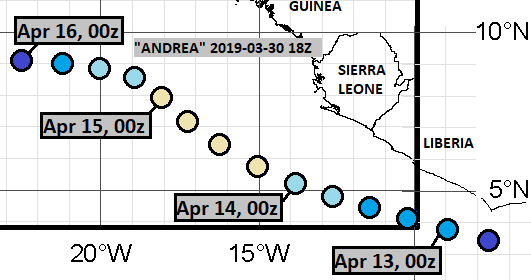
Ghost storm L#06
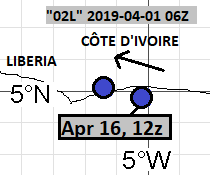
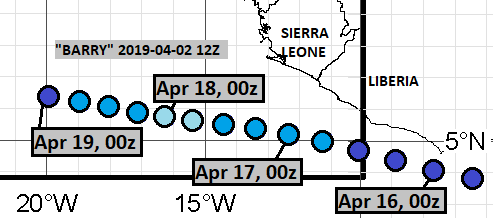
This is identifiable with absolutely nothing. A very low latitude hurricane in April, recurving into Africa? Ridiculous.
March 29, 12Z run:
March 30, 12Z run:
March 30, 18Z run:
March 31, 00Z run:
April 1, 06Z run:
April 2, 12Z run:
April 2, 18Z run:
Ghost storm L#07
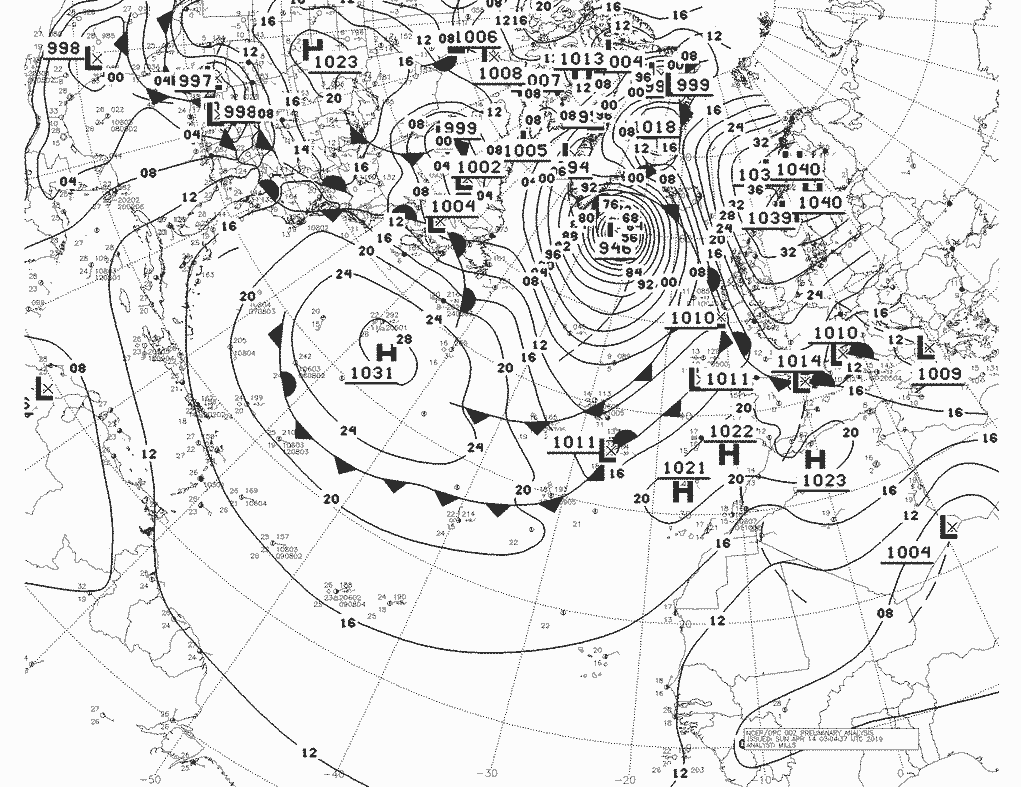
This is best identifiable with the 1011 mbar low south of the Azores in this synoptic chart. Could be the more northeastern 1011 mbar almost as well.

March 31, 12Z run:
April 1, 06Z run:
April 2, 12Z run:
Ghost storm L#08
This isn't identifiable with anything due to long lead time.
April 3, 00Z run:
April 3, 06Z run:
April 3, 18Z run:
April 4, 06Z run:
April 4, 12Z run:
April 4, 18Z run:
April 5, 06Z run:
April 6, 06Z run:
April 6, 18Z run:
April 7, 06Z run:
April 8, 06Z run:
Ghost storm L#09
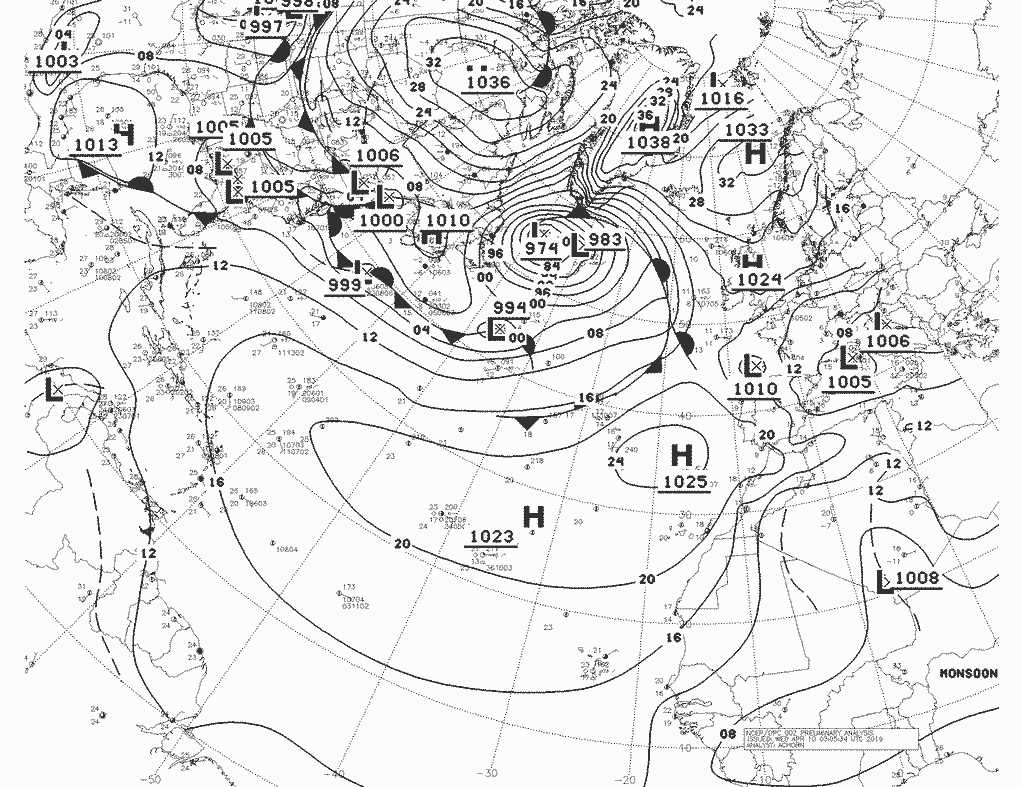
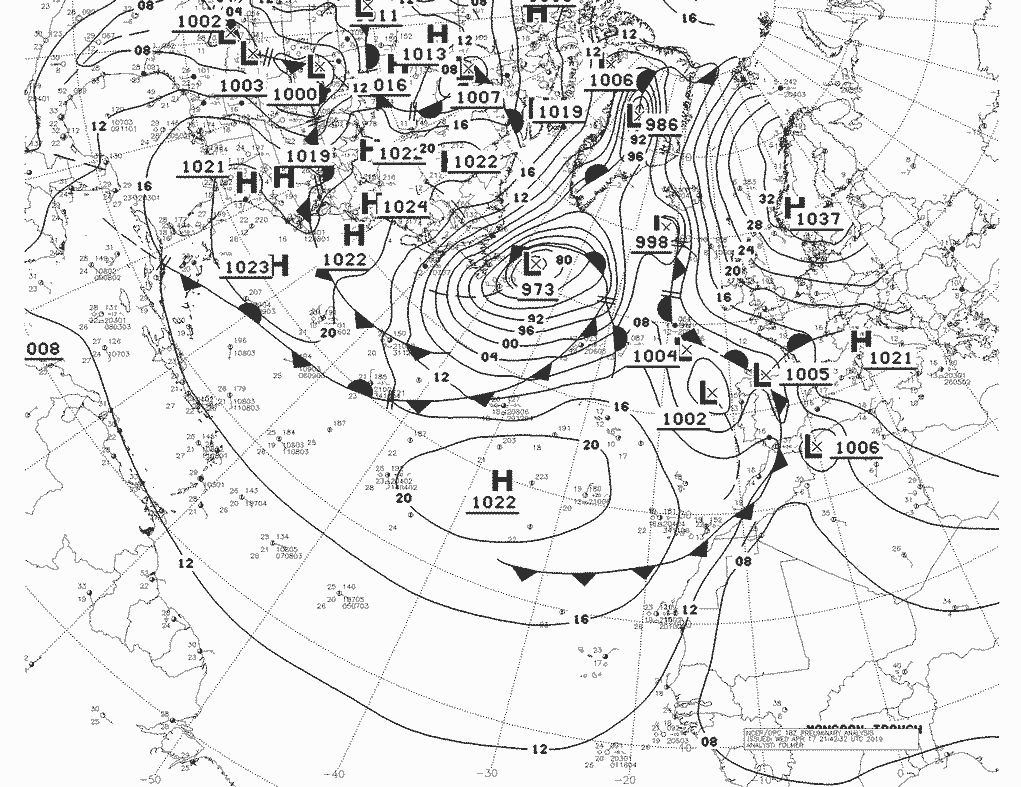
This incident is identifiable with the 1010 mbar low in Bay of Biscay in this chart.

April 4, 18Z run:
Ghost storm L#10
These are definitely not identifiable.
April 7, 18Z run:
April 10, 00Z run:
Ghost storm L#11
This single low-latitude hurricane is not identifiable.
April 8, 06Z run:
Ghost storm L#12
This single track is identifiable with this 1002 mbar low near Portugal in the following synoptic chart.
April 16, 06Z run:
Ghost storm #13
This is not identifiable at all.
April 19, 06Z run:
Ghost storm L#14
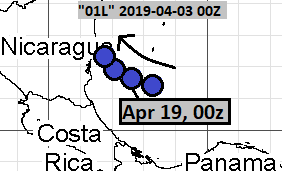
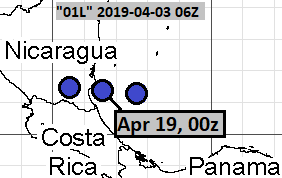
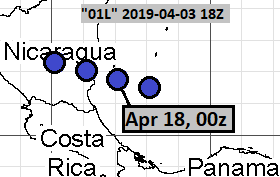
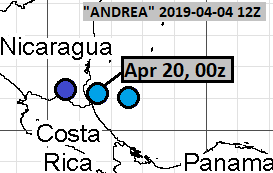
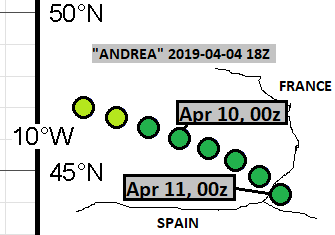
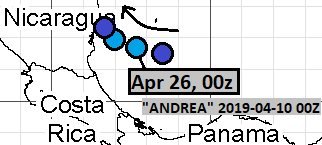
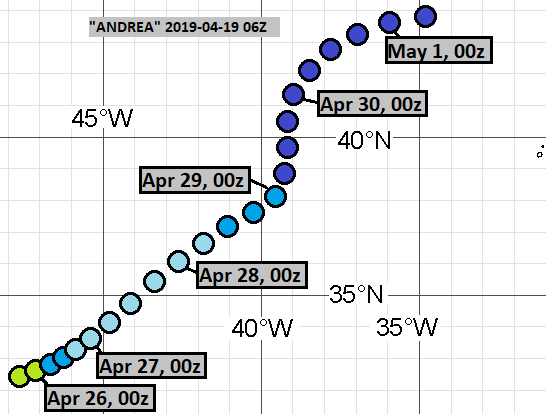
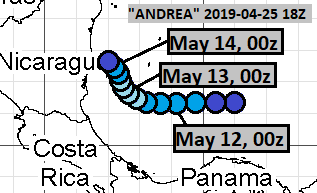
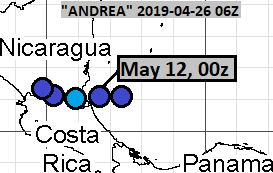
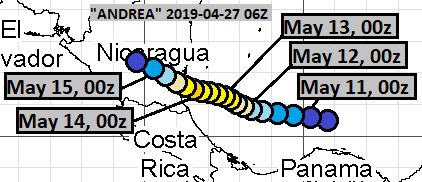
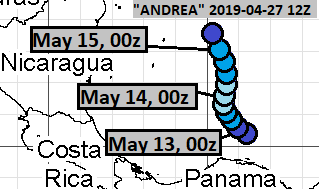
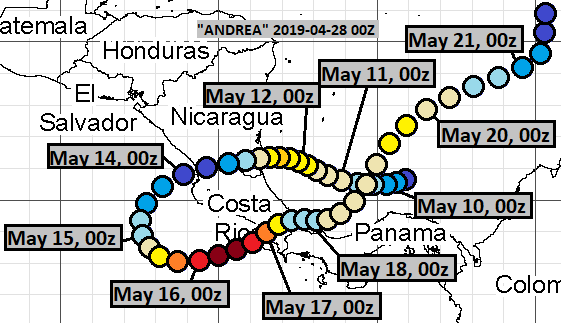
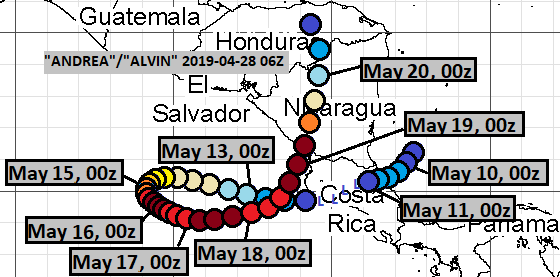
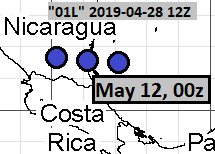
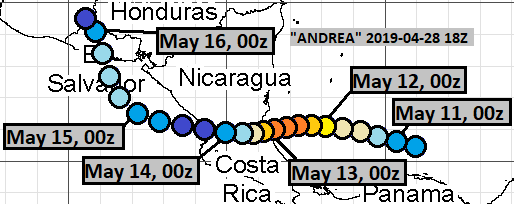
This persistent signal did have huge shifts in timing and position. Despite the system eventually acquiring rather short lead time, identification with anything is not possible.
April 25, 18Z run:
April 26, 06Z run:
April 27, 06Z run:
April 27, 12Z run:
April 28, 00Z run:
April 28, 06Z run:
April 28, 12Z run:
April 28, 18Z run:
April 29, 06Z run:
April 29, 12Z run:
April 29, 18Z run:
April 30, 06Z run:
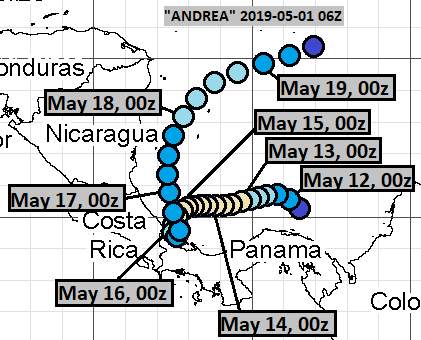
May 1, 06Z run:
May 1, 12Z run:
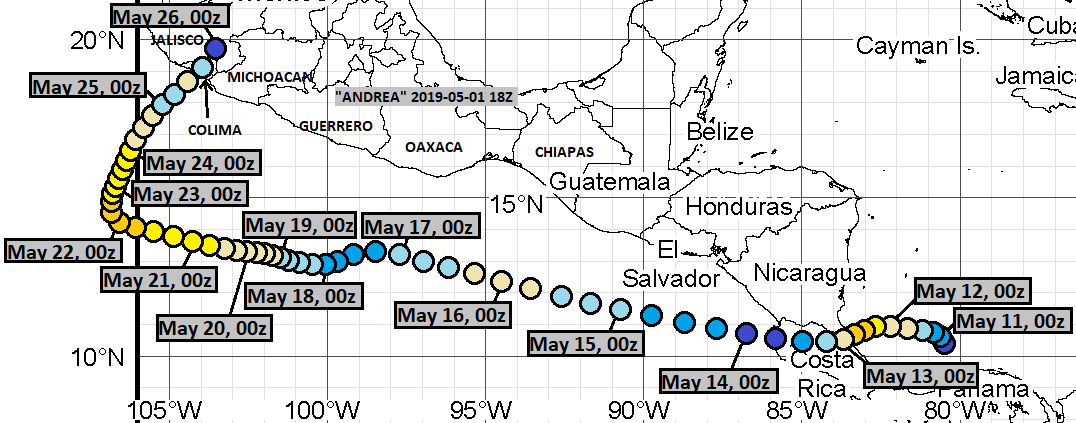
May 1, 18Z run:
May 2, 06Z run:
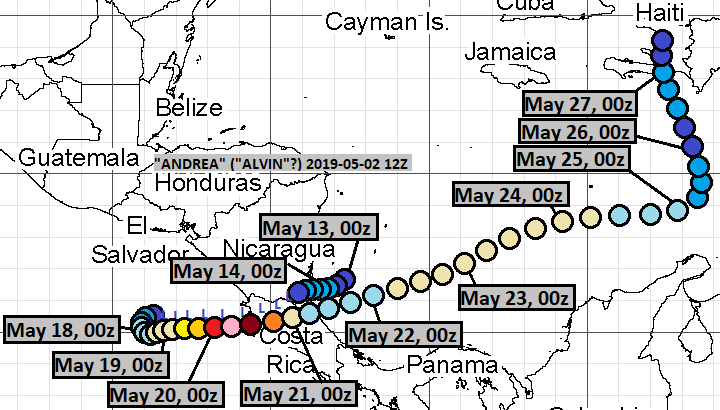
May 2, 12Z run:
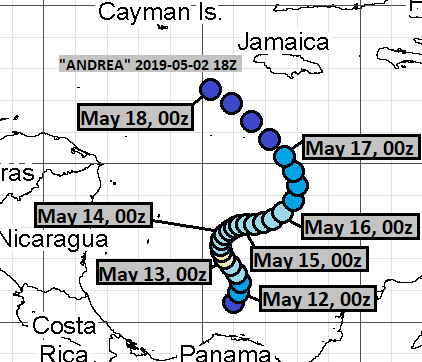
May 2, 18Z run:
May 3, 12Z run:
May 4, 12Z run:
May 6, 12Z run:
May 8, 12Z run:
May 9, 12Z run:
Ghost storm L#15
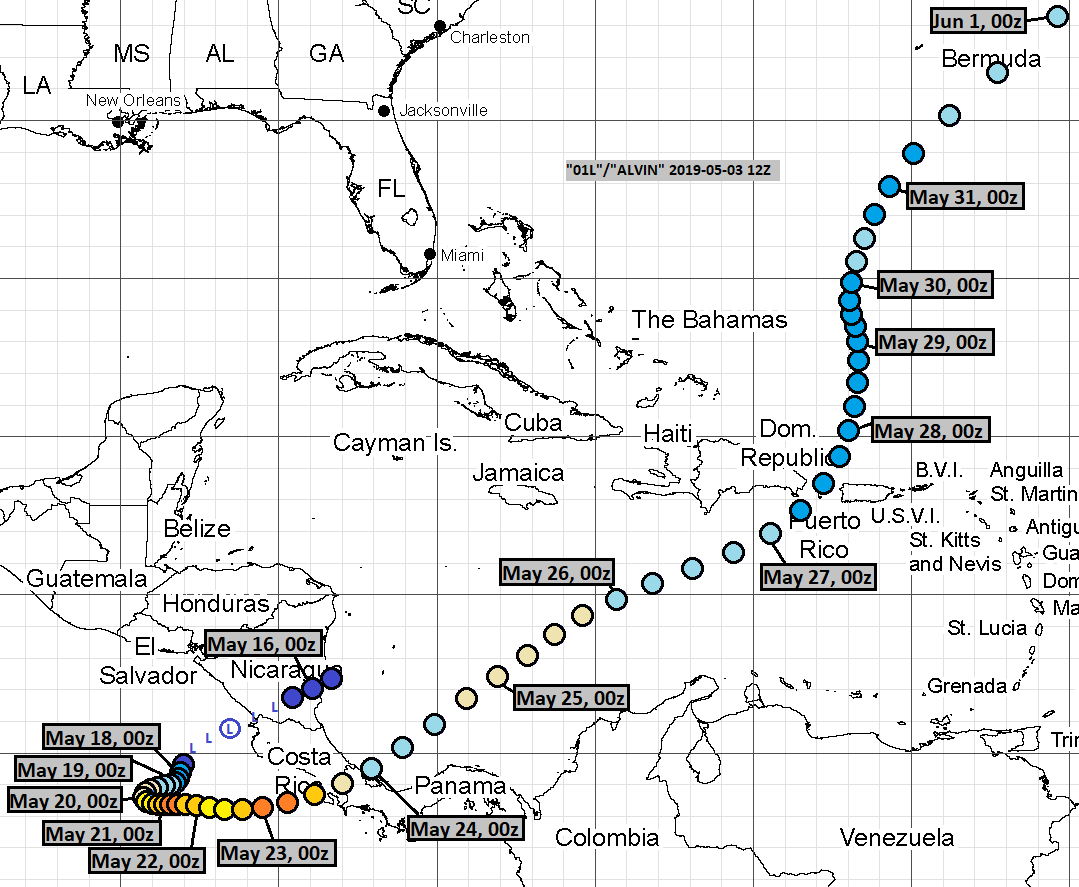
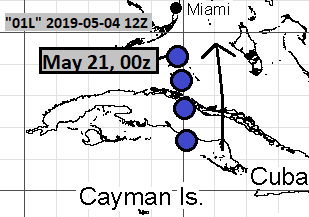
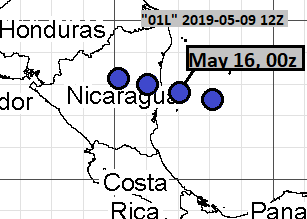
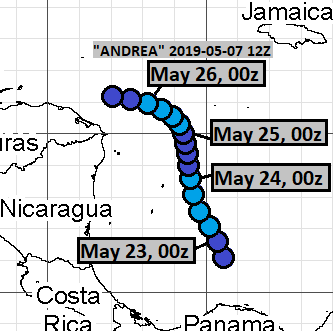
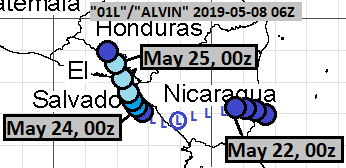
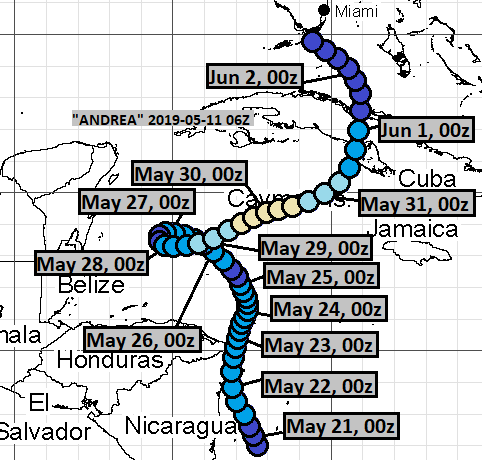
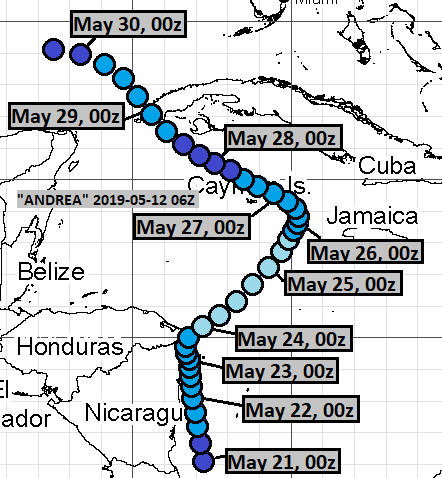
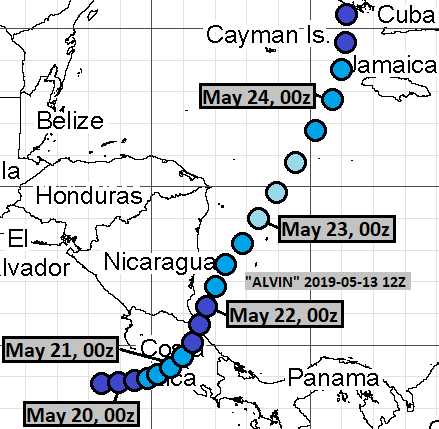
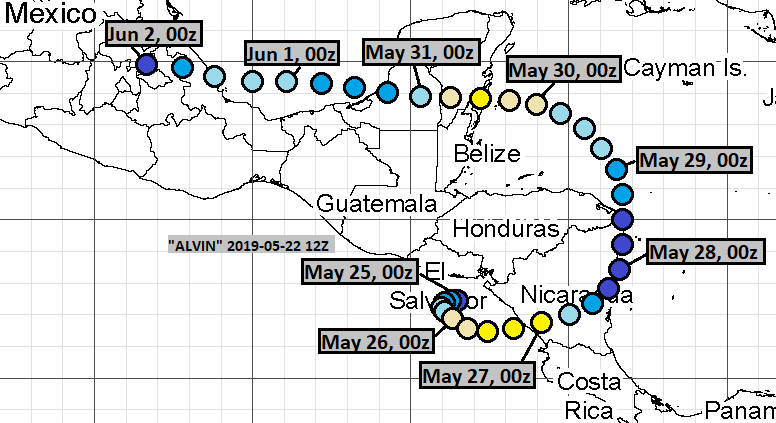
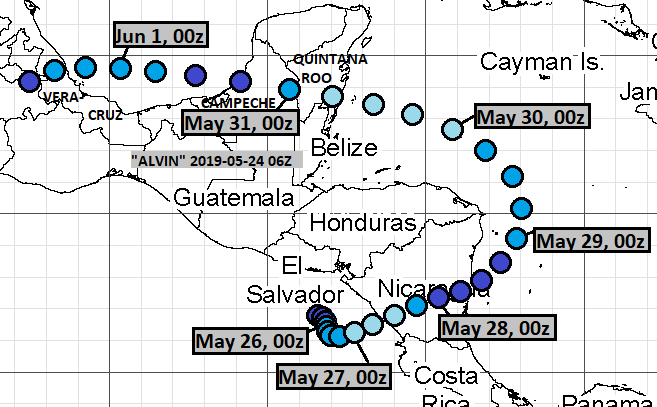
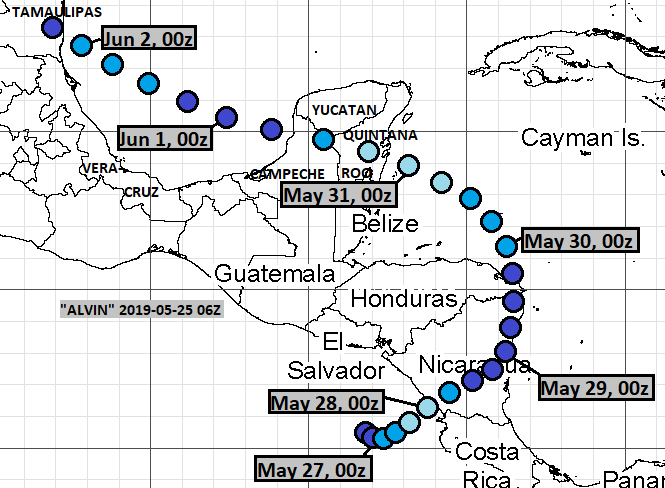
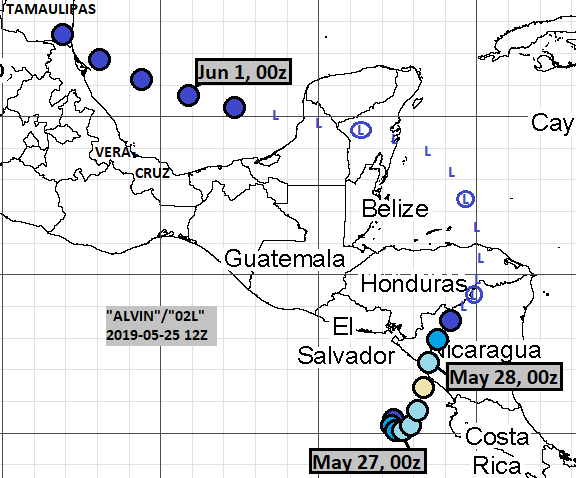
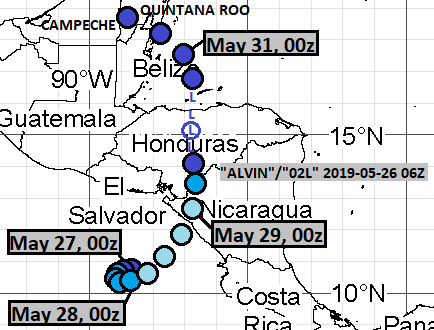
Another putative Caribbean spin, in timing just after L#14. The label L#15 was ended, when the area of cyclogenesis shifted to EPac. Through that shift, and further shifts, this is identifiable with labels E#17 and L#20, and identifiable with Invest 91E and Invest 91L.
May 5, 12Z run:
May 6, 18Z run:
May 7, 00Z run:
May 7, 12Z run:
May 7, 18Z run:
May 8, 06Z run:
May 8, 12Z run:
May 8, 18Z run:
May 9, 06Z run:
May 9, 12Z run:
May 9, 18Z run:
May 11, 06Z run:
May 11, 12Z run:
May 12, 06Z run:
May 12, 12Z run:
May 12, 18Z run:
Ghost storm L#16
Another day, another ghost, same Caribbean. This is not really much separate from L#15 and all its relations and identifications.
May 9, 12Z run:
May 9, 18Z run:
Ghost storm E#17
Main identification Invest 91E, other direct connections Invest 91L, L#15 and L#20. Only the tracks with Atlantic crossovers shown.
May 13, 06Z run:
May 13, 12Z run:
May 22, 12Z run:
May 24, 06Z run:
May 25, 06Z run:
May 25, 12Z run:
May 26, 06Z run:
Ghost storm L#17
This is not really identifiable with anything, but it should be said, that eventual timing and location don't actually differ much from the L#15 - E#17 - L#20 - Invest 91E - Invest 91L combo.
May 15, 12Z run:
May 16, 06Z run:
May 16, 12Z run:
May 16, 18Z run:
May 17, 06Z run:
May 17, 12Z run:
Ghost storm E#18
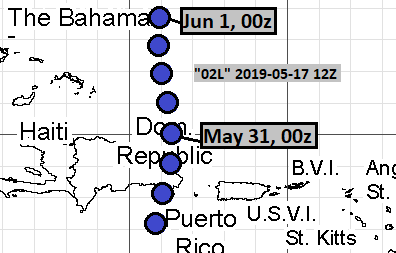
This had only one crossover from EPac.
May 16, 06Z run:
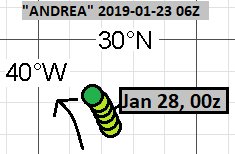
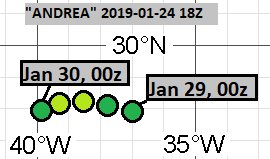
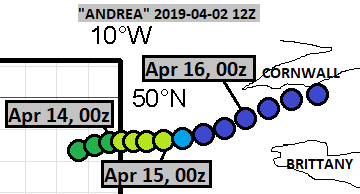
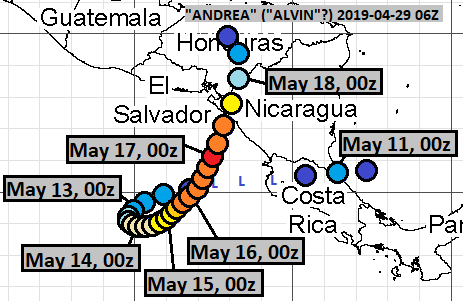
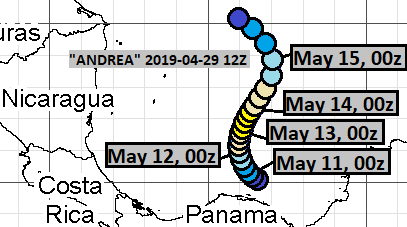
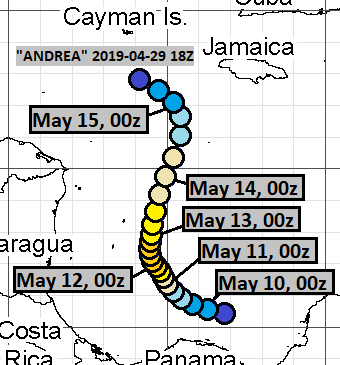
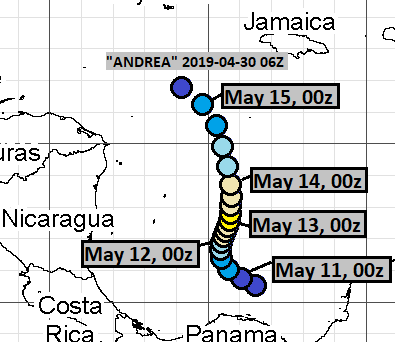
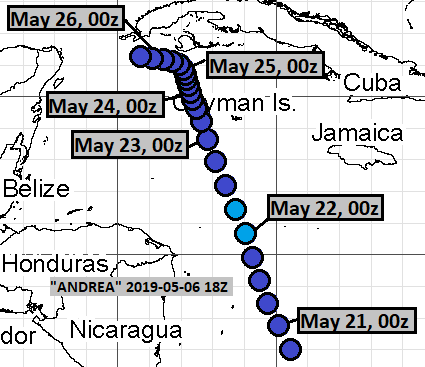
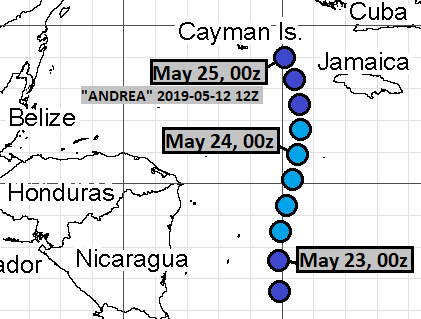
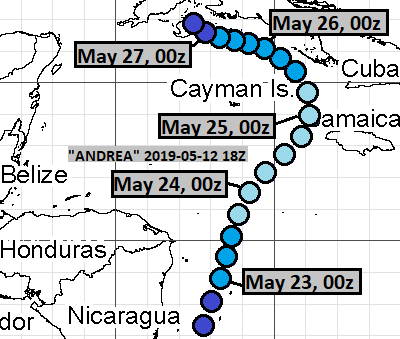
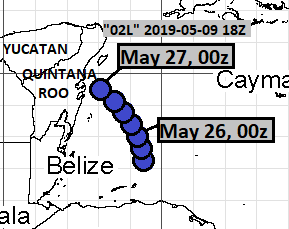
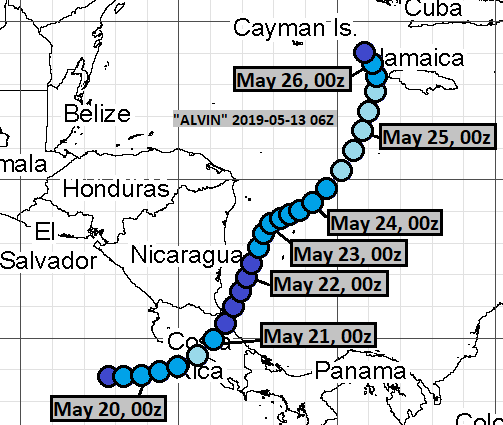
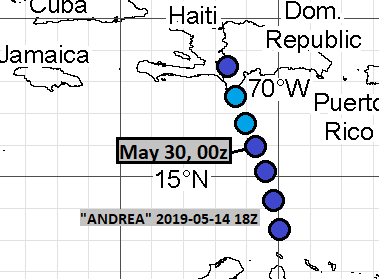
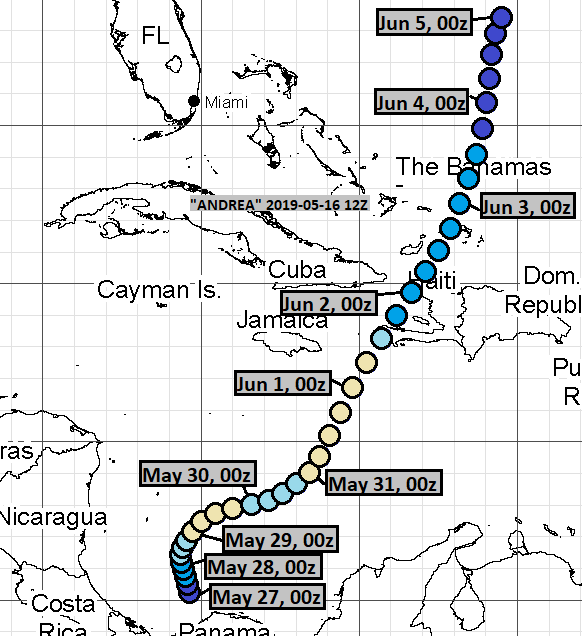
System L#18
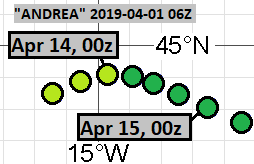
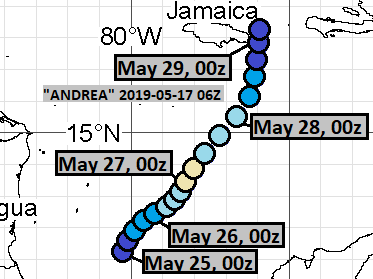
was not a ghost storm. Rather, it was Andrea.
Ghost storm L#19
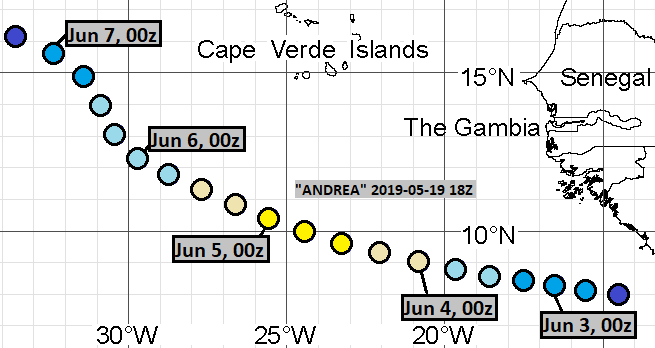
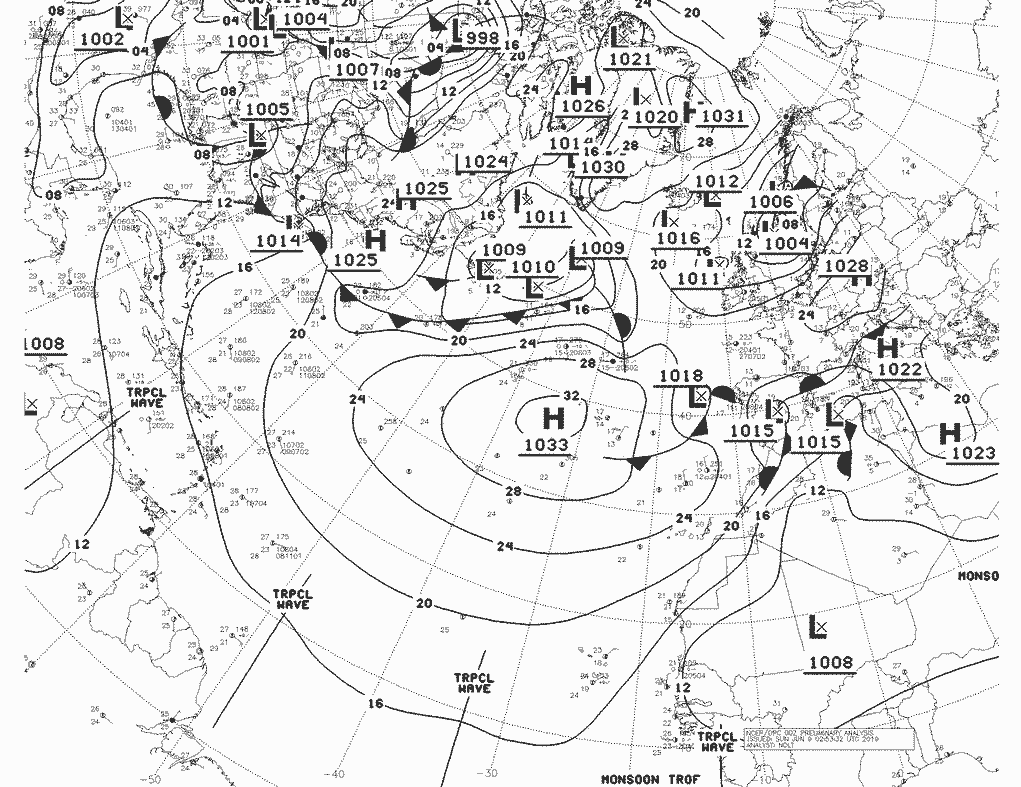
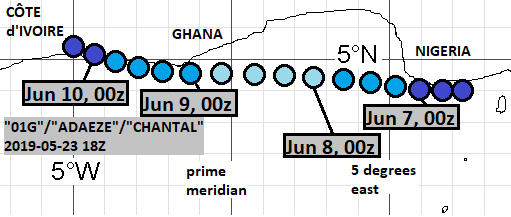
A Category 5 just off the coast of Africa in early June. Really? REALLY ????
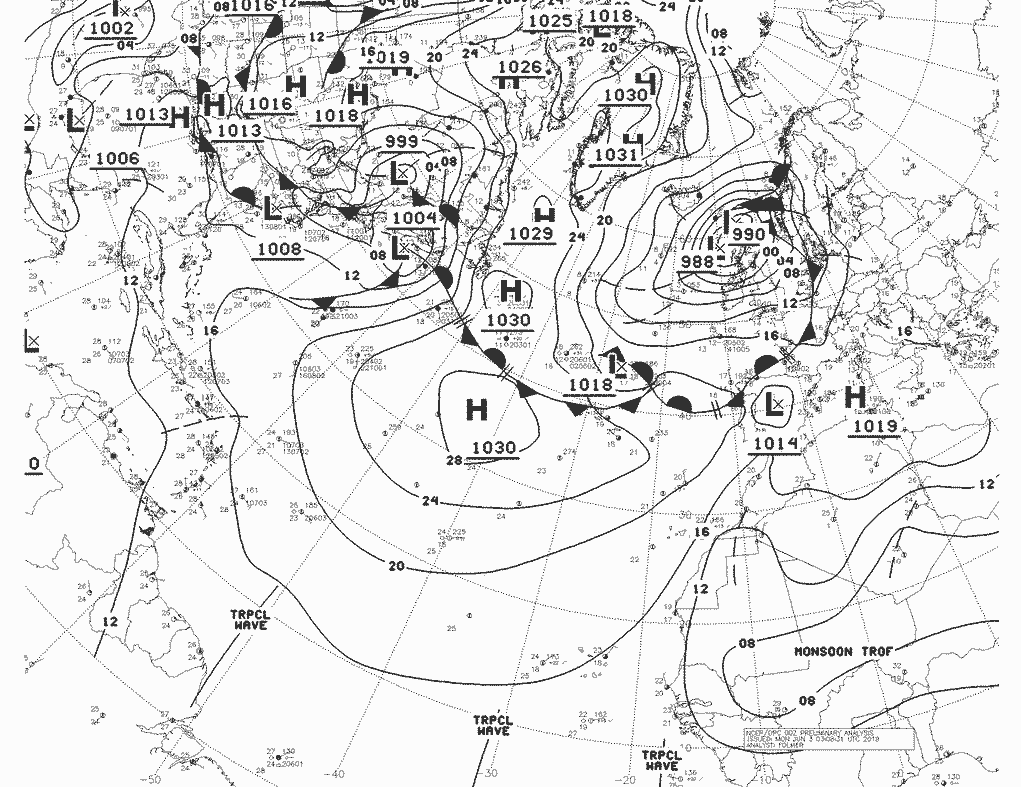
Anyway, this is best identifiable with a tropical wave, shown just off the coast of Africa in this synoptic chart.
May 18, 06Z run:
May 19, 18Z run:
May 21, 18Z run:
May 25, 06Z run:
May 25, 12Z run:
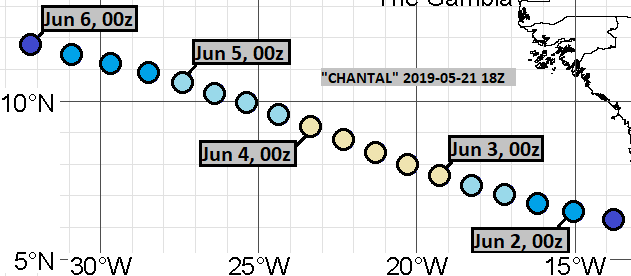
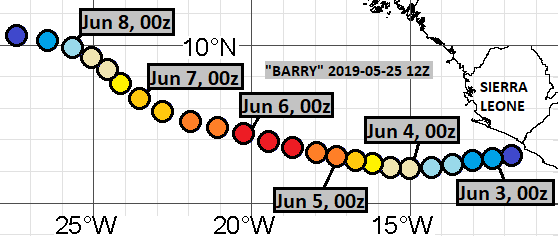
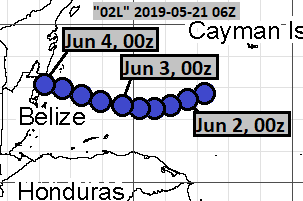
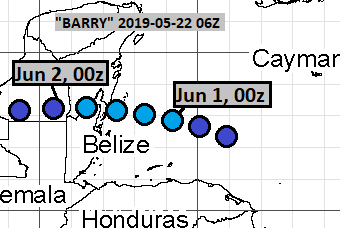
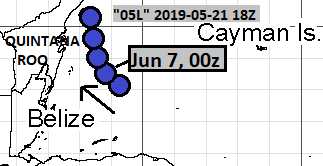
Ghost storm L#20
This was the final and closest equal to Invest 91L. As such, this is identifiable with L#15, E#17 and Invest 91E too. These tracks continued to be made in June. Here is a satellite picture of Invest 91L within a Tropical Weather Outlook:
May 21, 06Z run:
May 21, 12Z run:
May 21, 18Z run:
May 22, 06Z run:
May 22, 18Z run:
May 23, 06Z run:
May 23, 18Z run:
May 31, 18Z run:
Ghost storm L#21
This is identifiable with absolutely nothing.
May 21, 06Z run:
May 22, 18Z run:
Ghost storm L#22
Only tracks with at least part of them west of prime meridian are shown here. This is best identifiable with the tropical wave at African coast in following chart.
May 21, 12Z run:
May 23, 06Z run:
May 23, 18Z run:
May 26, 18Z run:
Ghost storm L#23
This lone track is identified with the 1003 mbar extratropical low in following synoptic chart.
May 21, 18Z run:
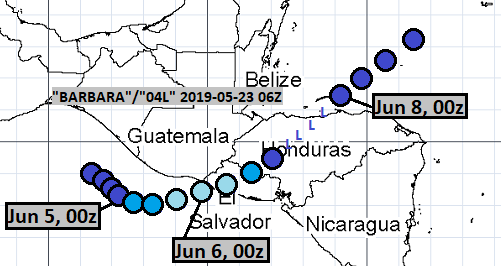
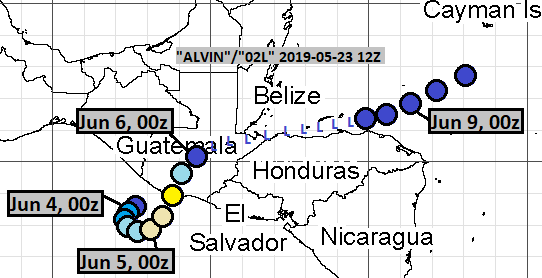
Ghost storm E#19
This system had only two tracks with crossover to Atlantic.
May 23, 06Z run:
May 23, 12Z run:
Ghost storm L#24
This is not identifiable due to long lead time and inconsistent timing. These tracks continued in June.
May 28, 06Z run:
May 31, 18Z run:
Ghost storm L#25
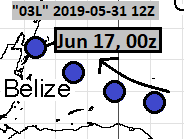
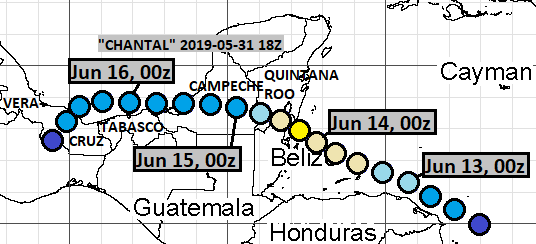
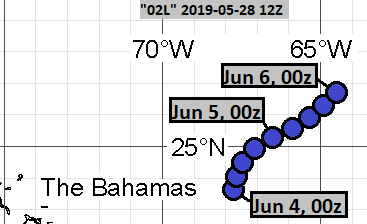
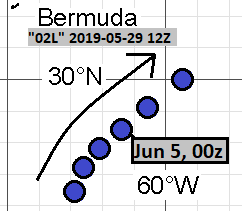
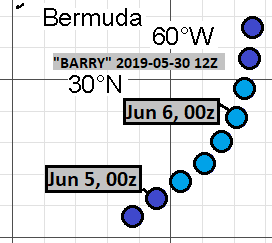
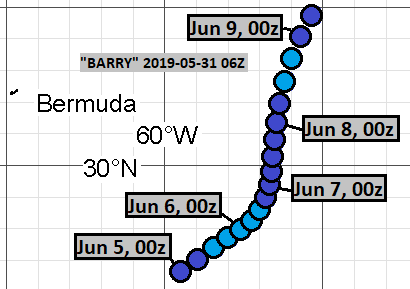
This bizarre system showed no consistency in position and timing. Therefore, despite occasionally pretty short lead time, it is hardly identifiable. These tracks continued in June.
May 28, 12Z run:
May 29, 06Z run:
May 29, 12Z run:























































Comments
Post a Comment