Verification of tracks made on Lee (2017) using GEFS mean fields
This is a repost from early 2018
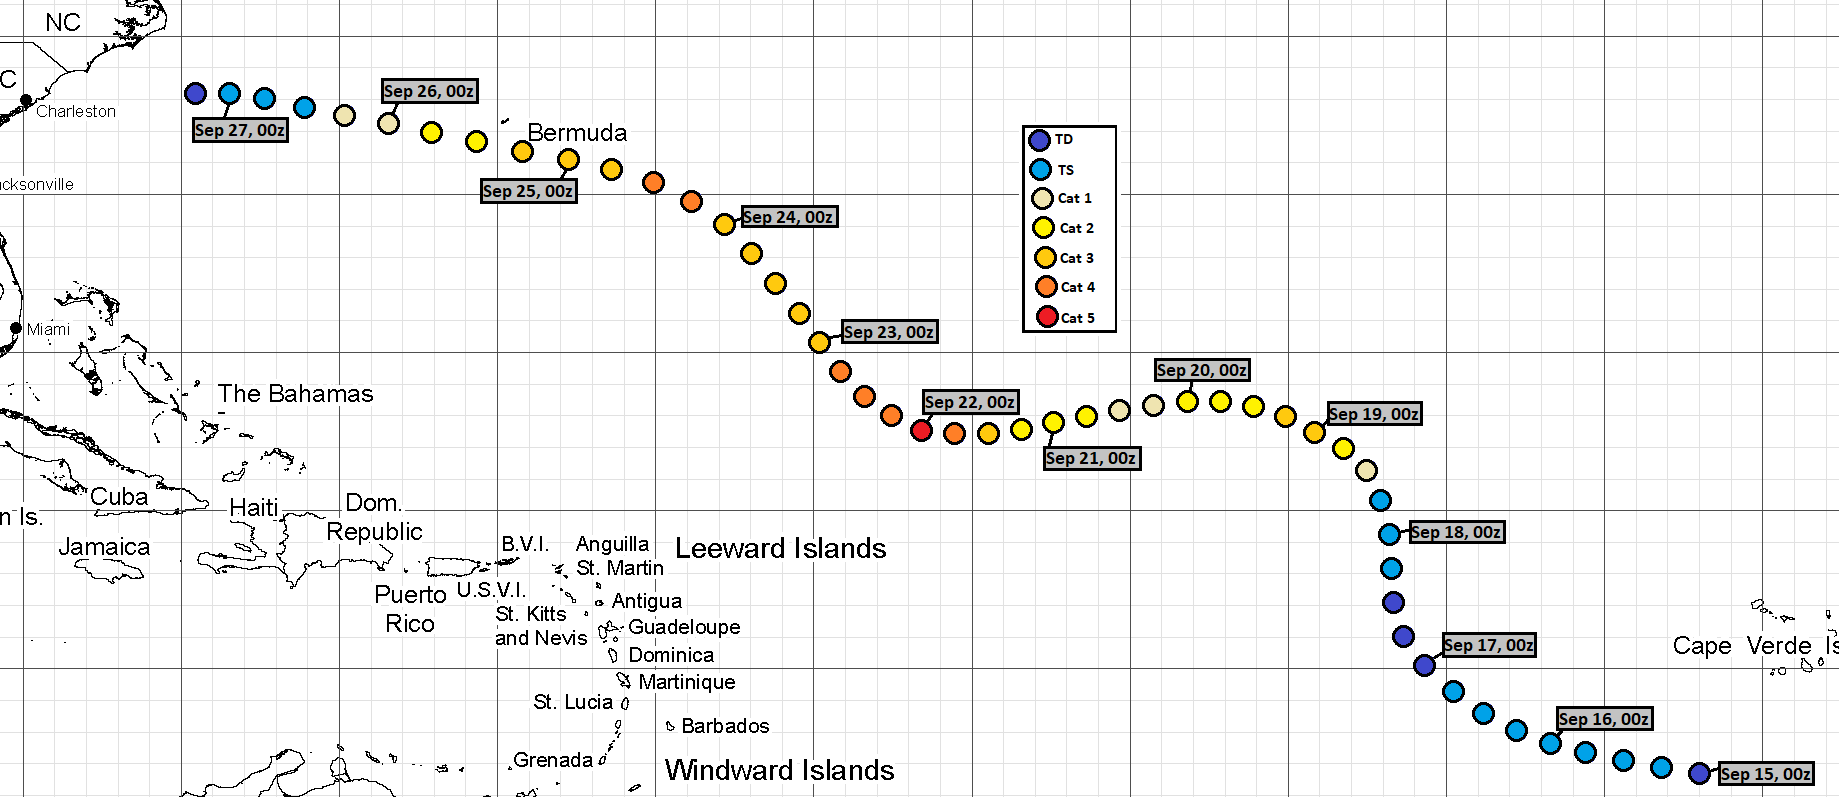
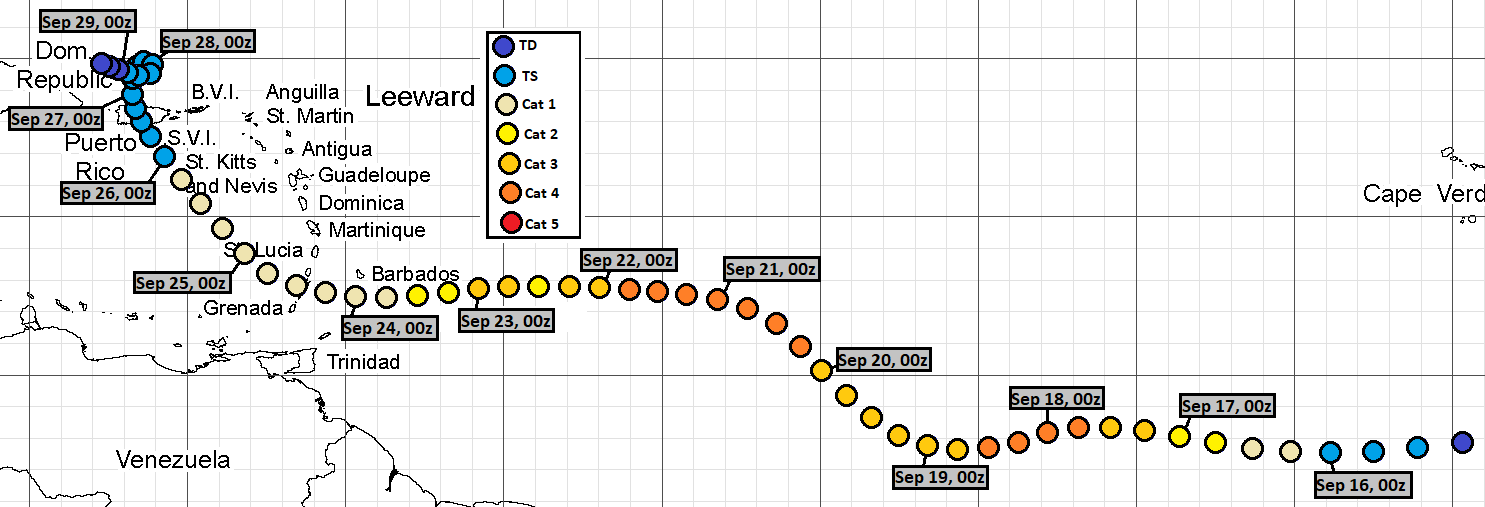
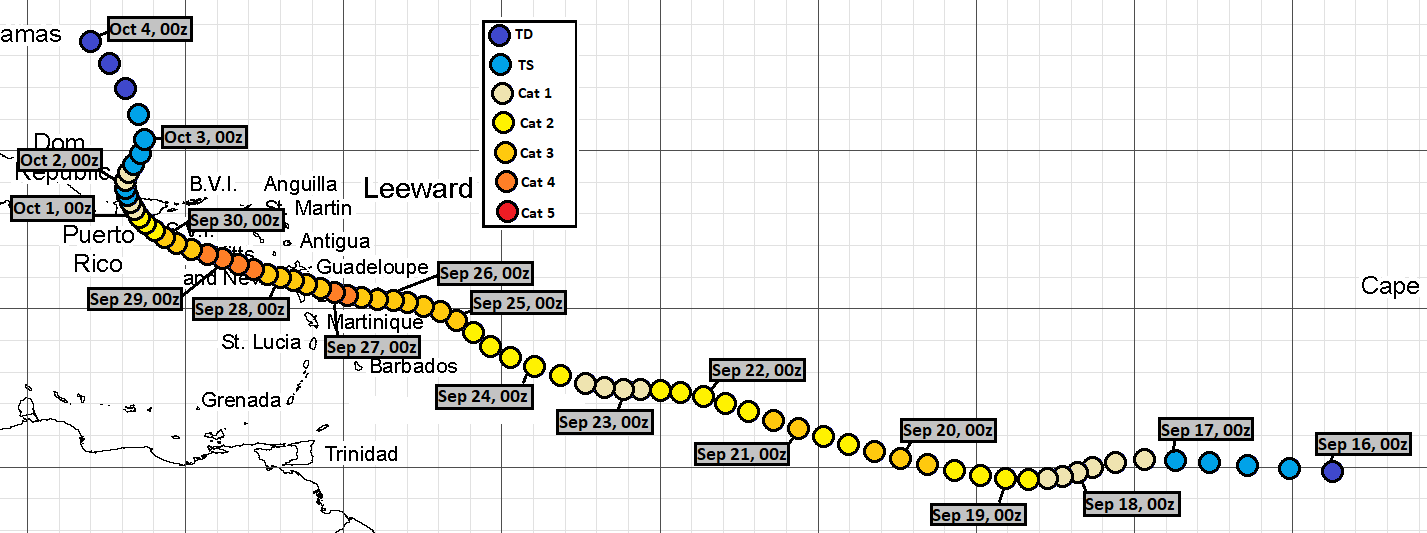
I made eight tracks about Hurricane Lee. Additionally, there were three runs, where I missed the system entirely. My predicted peak intensity varied highly from track to track, though by average the forecast was pretty skilled. However, the time and place of the peak intensity was way off. On average, the total time of Lee as a tropical cyclone was well forecast. However, none of the tracks anticipated, that Lee would be a TC twice. None of the tracks brought Lee into northern subtropics.
It should be noted, that the tracks by my technique is not capable of making abrupt jumps. The remnant low of Lee relocated by over five degrees of latitude between successive best track points.
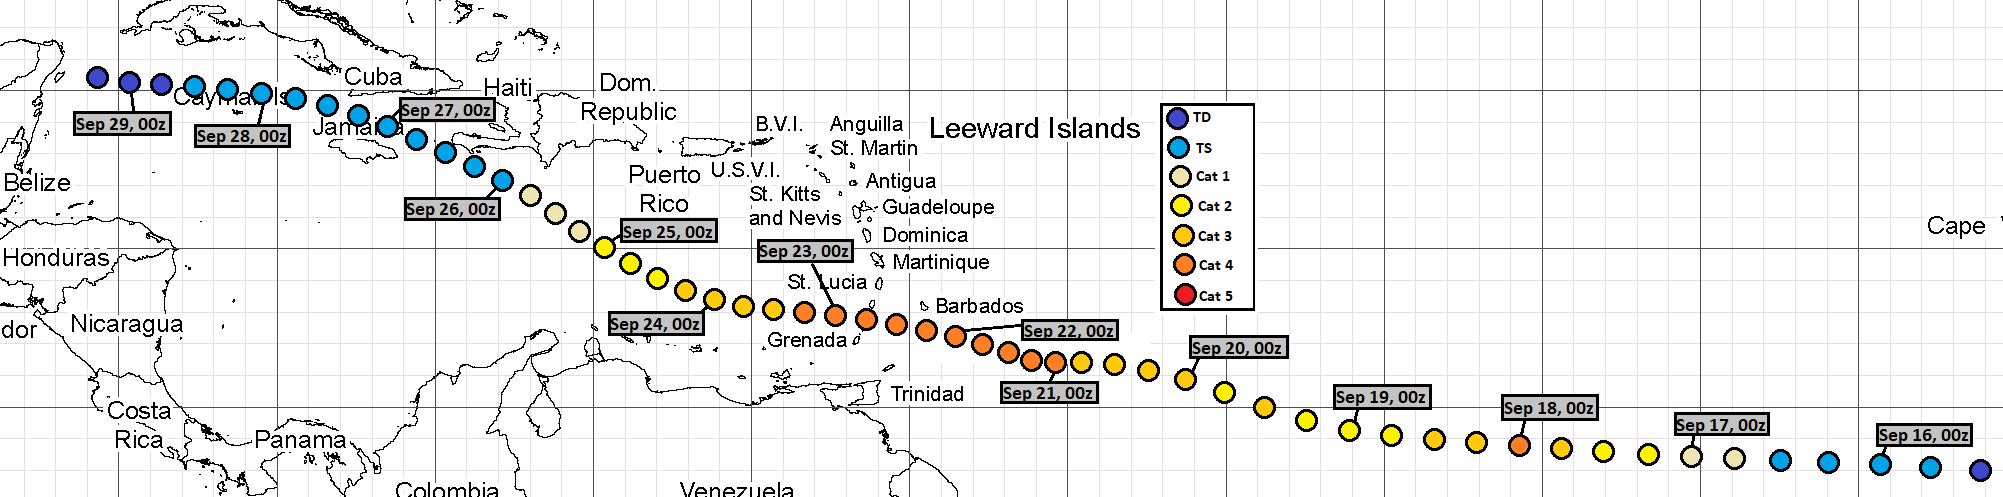
It is also interesting, that during September 11 - 14, there was a pattern, where either Lee or Maria became strong storms hitting the Caribbean, but never both of them in the same run. My technique is not capable of taking into account interactions between two storms. The lack of influence from Maria in my technique could partially explain, why Lee failed to turn north in most of my tracks.
None of my tracks began before the first best track entry as TC at September 15, 00Z, and my analysis begins there. My position analysis ends at the last best track entry at September 30, 06Z. My intensity analysis ends at October 4, 00Z, after which none of my tracks showed a tropical cyclone.
Since I give only SSHS categories in my tracks, I don't calculate intensity errors in units of speed, but in categories. For this purpose, I define tropical storms as "Category 0", tropical depressions as "Category -1" and non-existence of a tropical cyclone as "Category -2".
I compare intensities only in cases, when either the best track data or my track has a tropical cyclone, or both. In other words, I leave the comparison out of calculations, if both best track data and my track lack a tropical cyclone.
In the eight tracks, formation times ranged between September 15, 00Z and September 22, 18Z. Median was September 16, 15Z and average was September 17, 15Z.
The 11 peak intensities (those three complete misses included) ranged between non-formation (Category -2) to Category 5. Median was Category 0 and average was Category +1.0.
Dissipation times ranged between September 21, 00Z and October 4, 06Z. Median was September 27, 06Z and average was September 26, 23Z.
The following lines will have the format:
date and time (UTC) yyyy/mm/dd/hh ... number of true detections ... number of misses ... number of false detections ... number of position comparisons ... number of intensity comparisons ... average error in intensity category ... bias in intensity category ... average error in latitude ... bias in latitude ... average error in longitude ... bias in longitude ... upper limit for scalar error in position (nautical miles)... calculated scalar bias in position (nautical miles)
First dissipation:
2017/09/19/00 ... 0 ... 0 ... 6 ... 6 ... 6 ... 3.7 ... +3.7 ... 4.5 ... 1.9S ... 3.1 ... 2.0E ... 330 ... 160
Regeneration:
2017/09/22/18 ... 6 ... 5 ... 0 ... 6 ... 11 ... 2.1 ... +1.2 ... 13.9 ... 13.9S ... 6.8 ... 6.8W ... 920 ... 920
Strengthening into a hurricane...
2017/09/24/06 ... 6 ... 5 ... 0 ... 6 ... 11 ... 2.1 ... -1.0 ... 14.1 ... 14.1S ... 10.6 ... 10.6W ... 1040 ... 1040
...and into major hurricane:
2017/09/27/12 ... 3 ... 8 ... 0 ... 3 ... 11 ... 4.2 ... -4.2 ... 11.9 ... 11.9S ... 12.1 ... 12.1W ... 990 ... 990
And for lead times:
168h ... 0 ... 2 ... 3 ... 3 ... 5 ... 3.0 ... +2.2 ... 8.6 ... 8.6S ... 2.5 ... 0.3W ... 540 ... 520
192h ... 0 ... 0 ... 3 ... 3 ... 3 ... 5.0 ... +5.0 ... 13.3 ... 13.3S ... 2.7 ... 2.3W ... 820 ... 810
216h ... 0 ... 2 ... 3 ... 5 ... 5 ... 4.0 ... +2.4 ... 11.5 ... 11.5S ... 3.4 ... 3.4W ... 720 ... 720
240h ... 1 ... 3 ... 2 ... 5 ... 6 ... 3.2 ... +0.5 ... 14.7 ... 14.7S ... 5.8 ... 5.8W ... 950 ... 950
264h ... 3 ... 3 ... 1 ... 5 ... 7 ... 2.6 ... 0.0 ... 15.7 ... 15.7S ... 8.3 ... 8.3W ... 1060 ... 1060
288h ... 5 ... 4 ... 0 ... 5 ... 9 ... 1.8 ... -0.9 ... 15.8 ... 15.8S ... 11.1 ... 11.1W ... 1150 ... 1150
312h ... 5 ... 5 ... 0 ... 5 ... 10 ...1.8 ... -1.6 ... 14.3 ... 14.3S ... 12.9 ... 12.9W ... 1140 ... 1140
336h ... 5 ... 6 ... 0 ... 5 ... 11 ... 2.3 ... -2.1 ... 10.7 ... 10.4S ... 10.4 ... 10.4W ... 890 ... 880
360h ... 5 ... 6 ... 0 ... 5 ... 11 ... 2.5 ... -2.0 ... 9.9 ... 9.8S ... 9.7 ... 9.7W ... 820 ... 820
384h ... 4 ... 4 ... 0 ... 4 ... 8 ... 2.5 ... -2.0 ... 12.7 ... 11.1S ... 12.1 ... 12.1W .... 1040 ... 970
408h ... 3 ... 2 ... 1 ... 3 ... 6 ... 2.8 ... -1.2 ... 14.2 ... 9.9S ... 16.8 ... 15.5W ... 1300 ... 1080
432h ... 0 ... 2 ... 2 ... 1 ... 4 ... 3.3 ... +0.3 ... 7.6 ... 7.6N ... 3.1 ... 3.1E ... 490 ... 490
456h ... 0 ... 0 ... 2 ... 1 ... 2 ... 2.5 ... +2.5 ... 5.4 ... 5.4N ... 1.3 ... 1.3E ... 330 ... 330
480h ... 0 ... 1 ... 2 ... 1 ... 3 ... 2.3 ... +1.0 ... 4.2 ... 4.2S ... 1.7 ... 1.7W ... 270 ... 270
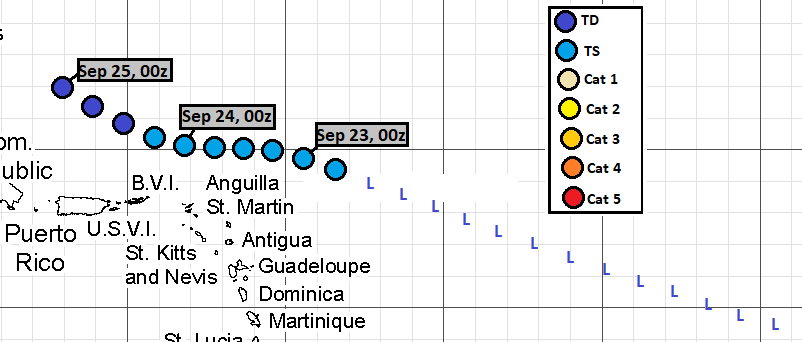
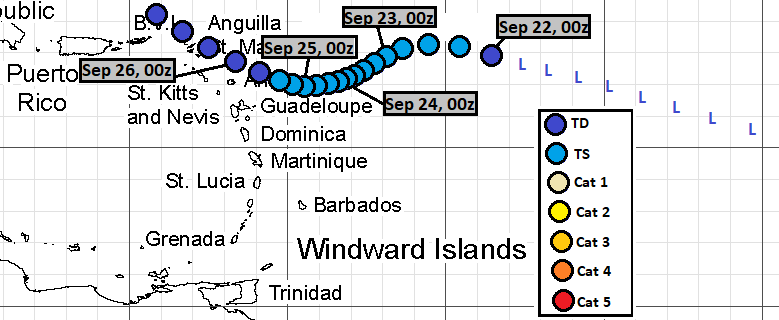
Here are the tracks once again.
September 1, 06Z run:
 September 11, 06Z run:
 September 11, 12Z run:
 September 12, 06Z run:
 September 12, 12Z run:
 September 13, 12Z run:
 September 14, 06Z run:
 September 14, 12Z run:
 The runs, which I analysed, but failed to generate a track were:
September 2, 06Z
September 3, 06Z
September 13, 06Z
I made eight tracks about Hurricane Lee. Additionally, there were three runs, where I missed the system entirely. My predicted peak intensity varied highly from track to track, though by average the forecast was pretty skilled. However, the time and place of the peak intensity was way off. On average, the total time of Lee as a tropical cyclone was well forecast. However, none of the tracks anticipated, that Lee would be a TC twice. None of the tracks brought Lee into northern subtropics.
It should be noted, that the tracks by my technique is not capable of making abrupt jumps. The remnant low of Lee relocated by over five degrees of latitude between successive best track points.
It is also interesting, that during September 11 - 14, there was a pattern, where either Lee or Maria became strong storms hitting the Caribbean, but never both of them in the same run. My technique is not capable of taking into account interactions between two storms. The lack of influence from Maria in my technique could partially explain, why Lee failed to turn north in most of my tracks.
None of my tracks began before the first best track entry as TC at September 15, 00Z, and my analysis begins there. My position analysis ends at the last best track entry at September 30, 06Z. My intensity analysis ends at October 4, 00Z, after which none of my tracks showed a tropical cyclone.
Since I give only SSHS categories in my tracks, I don't calculate intensity errors in units of speed, but in categories. For this purpose, I define tropical storms as "Category 0", tropical depressions as "Category -1" and non-existence of a tropical cyclone as "Category -2".
I compare intensities only in cases, when either the best track data or my track has a tropical cyclone, or both. In other words, I leave the comparison out of calculations, if both best track data and my track lack a tropical cyclone.
In the eight tracks, formation times ranged between September 15, 00Z and September 22, 18Z. Median was September 16, 15Z and average was September 17, 15Z.
The 11 peak intensities (those three complete misses included) ranged between non-formation (Category -2) to Category 5. Median was Category 0 and average was Category +1.0.
Dissipation times ranged between September 21, 00Z and October 4, 06Z. Median was September 27, 06Z and average was September 26, 23Z.
The following lines will have the format:
date and time (UTC) yyyy/mm/dd/hh ... number of true detections ... number of misses ... number of false detections ... number of position comparisons ... number of intensity comparisons ... average error in intensity category ... bias in intensity category ... average error in latitude ... bias in latitude ... average error in longitude ... bias in longitude ... upper limit for scalar error in position (nautical miles)... calculated scalar bias in position (nautical miles)
First dissipation:
2017/09/19/00 ... 0 ... 0 ... 6 ... 6 ... 6 ... 3.7 ... +3.7 ... 4.5 ... 1.9S ... 3.1 ... 2.0E ... 330 ... 160
Regeneration:
2017/09/22/18 ... 6 ... 5 ... 0 ... 6 ... 11 ... 2.1 ... +1.2 ... 13.9 ... 13.9S ... 6.8 ... 6.8W ... 920 ... 920
Strengthening into a hurricane...
2017/09/24/06 ... 6 ... 5 ... 0 ... 6 ... 11 ... 2.1 ... -1.0 ... 14.1 ... 14.1S ... 10.6 ... 10.6W ... 1040 ... 1040
...and into major hurricane:
2017/09/27/12 ... 3 ... 8 ... 0 ... 3 ... 11 ... 4.2 ... -4.2 ... 11.9 ... 11.9S ... 12.1 ... 12.1W ... 990 ... 990
And for lead times:
168h ... 0 ... 2 ... 3 ... 3 ... 5 ... 3.0 ... +2.2 ... 8.6 ... 8.6S ... 2.5 ... 0.3W ... 540 ... 520
192h ... 0 ... 0 ... 3 ... 3 ... 3 ... 5.0 ... +5.0 ... 13.3 ... 13.3S ... 2.7 ... 2.3W ... 820 ... 810
216h ... 0 ... 2 ... 3 ... 5 ... 5 ... 4.0 ... +2.4 ... 11.5 ... 11.5S ... 3.4 ... 3.4W ... 720 ... 720
240h ... 1 ... 3 ... 2 ... 5 ... 6 ... 3.2 ... +0.5 ... 14.7 ... 14.7S ... 5.8 ... 5.8W ... 950 ... 950
264h ... 3 ... 3 ... 1 ... 5 ... 7 ... 2.6 ... 0.0 ... 15.7 ... 15.7S ... 8.3 ... 8.3W ... 1060 ... 1060
288h ... 5 ... 4 ... 0 ... 5 ... 9 ... 1.8 ... -0.9 ... 15.8 ... 15.8S ... 11.1 ... 11.1W ... 1150 ... 1150
312h ... 5 ... 5 ... 0 ... 5 ... 10 ...1.8 ... -1.6 ... 14.3 ... 14.3S ... 12.9 ... 12.9W ... 1140 ... 1140
336h ... 5 ... 6 ... 0 ... 5 ... 11 ... 2.3 ... -2.1 ... 10.7 ... 10.4S ... 10.4 ... 10.4W ... 890 ... 880
360h ... 5 ... 6 ... 0 ... 5 ... 11 ... 2.5 ... -2.0 ... 9.9 ... 9.8S ... 9.7 ... 9.7W ... 820 ... 820
384h ... 4 ... 4 ... 0 ... 4 ... 8 ... 2.5 ... -2.0 ... 12.7 ... 11.1S ... 12.1 ... 12.1W .... 1040 ... 970
408h ... 3 ... 2 ... 1 ... 3 ... 6 ... 2.8 ... -1.2 ... 14.2 ... 9.9S ... 16.8 ... 15.5W ... 1300 ... 1080
432h ... 0 ... 2 ... 2 ... 1 ... 4 ... 3.3 ... +0.3 ... 7.6 ... 7.6N ... 3.1 ... 3.1E ... 490 ... 490
456h ... 0 ... 0 ... 2 ... 1 ... 2 ... 2.5 ... +2.5 ... 5.4 ... 5.4N ... 1.3 ... 1.3E ... 330 ... 330
480h ... 0 ... 1 ... 2 ... 1 ... 3 ... 2.3 ... +1.0 ... 4.2 ... 4.2S ... 1.7 ... 1.7W ... 270 ... 270
Here are the tracks once again.
September 1, 06Z run:
September 2, 06Z
September 3, 06Z
September 13, 06Z


Comments
Post a Comment