Verification of Atlantic ghost storm tracks of June-July 2019
I falsely detected (sub)tropical cyclogenesis in Atlantic (north of
equator and west of Greenwich) 91 times in June and July of 2019. Tracks were made of 15 systems.
At the lead time of 1 day (24 hours), there were 6 false detections.
At the lead time of 2 days (48 hours), there were 9 false detections.
At the lead time of 3 days (72 hours), there were 6 false detections.
At the lead time of 4 days (96 hours), there were 6 false detections.
At the lead time of 5 days (120 hours), there were 6 false detections.
At the lead time of 6 days (144 hours), there were 8 false detections.
At the lead time of 7 days (168 hours), there were 6 false detections.
At the lead time of 8 days (192 hours), there were 10 false detections.
At the lead time of 9 days (216 hours), there were 14 false detections.
At the lead time of 10 days (240 hours), there were 20 false detections.
At the lead time of 11 days (264 hours), there were 41 false detections.
At the lead time of 12 days (288 hours), there were 43 false detections.
At the lead time of 13 days (312 hours), there were 50 false detections.
At the lead time of 14 days (336 hours), there were 43 false detections.
At the lead time of 15 days (360 hours), there were 36 false detections.
At the lead time of 16 days (384 hours), there were 36 false detections.
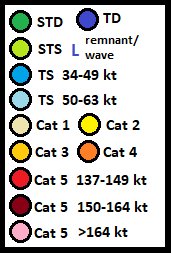
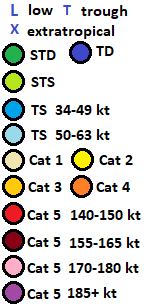
Circle coloration scheme
Ghost storm L#20
This was the final and closest equal to Invest 91L. As such, this is
identifiable with L#15, E#17 and Invest 91E too. These tracks began
to be made in May. Here is a satellite picture of Invest 91L within a
Tropical Weather Outlook:
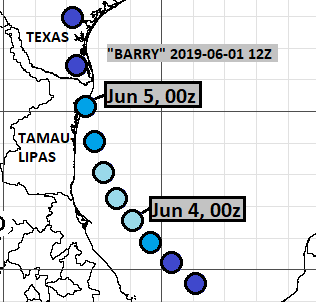
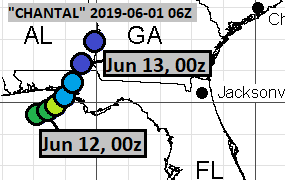
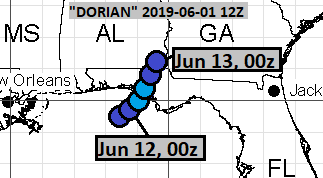
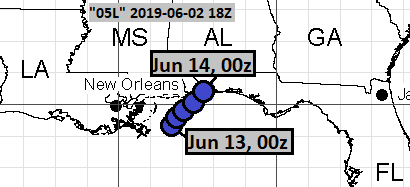
June 1, 12Z run:
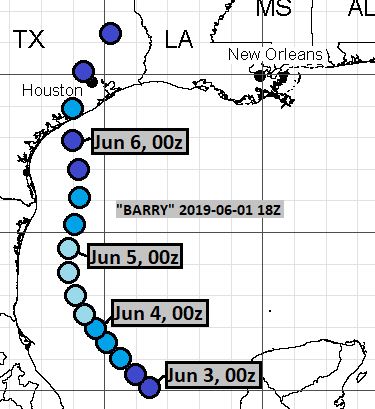
June 1, 18Z run:
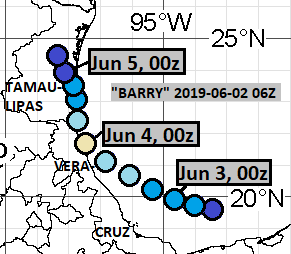
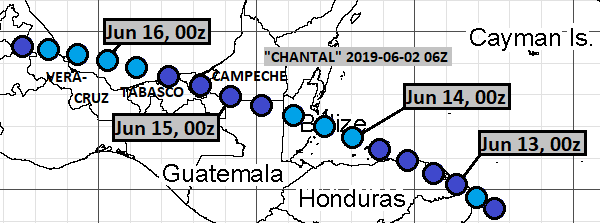
June 2, 06Z run:
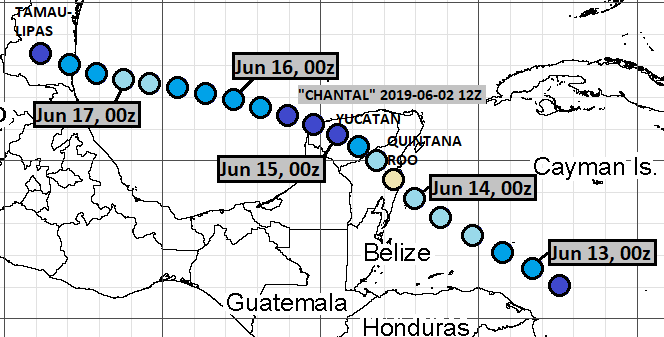
June 2, 12Z run:
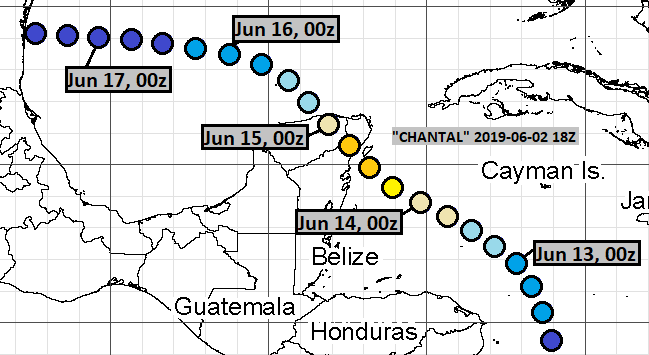
June 2, 18Z run:
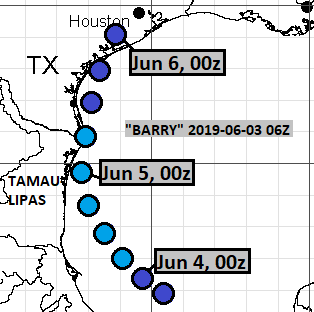
June 3, 06Z run:
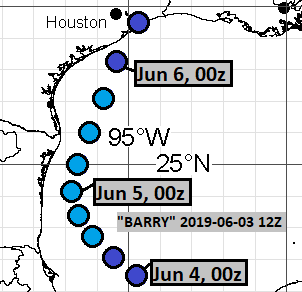
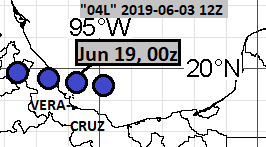
June 3, 12Z run:
June 3, 18Z run:
Ghost storm L#24
This is not identifiable due to long lead time and inconsistent timing. These tracks began in May.
June 1, 12Z run:
June 1, 18Z run:
June 2, 06Z run:
June 2, 12Z run:
June 2, 18Z run:
June 3, 06Z run:
June 3, 12Z run:
June 4, 18Z run:
Ghost storm L#25
This bizarre system showed no consistency in position and timing.
Therefore, despite occasionally pretty short lead time, it is hardly
identifiable. These tracks began in May.
June 1, 06Z run:
June 1, 12Z run:
June 1, 18Z run:
June 2, 18Z run:
June 3, 06Z run:
June 3, 18Z run:
June 4, 12Z run:
June 6, 12Z run:
Ghost storm L#26
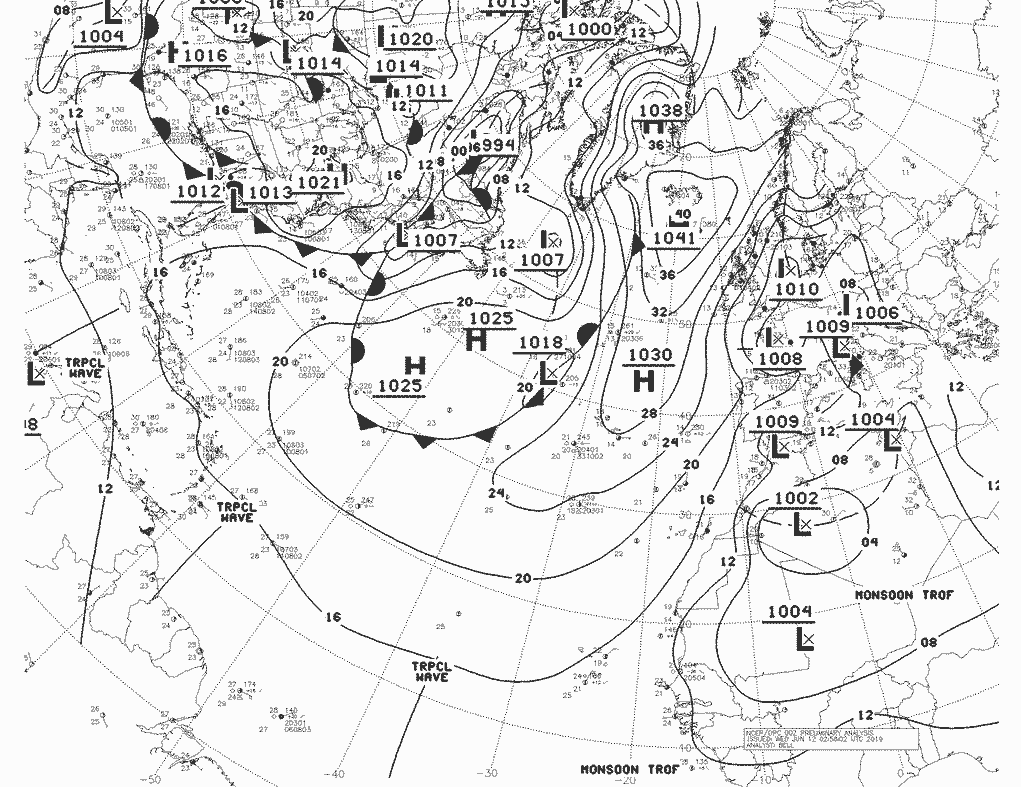
This is identifiable with the 1012mbar low marked near FL Big Bend in following synoptic chart.
June 1, 06Z run:
June 1, 12Z run:
June 2, 18Z run:
June 3, 12Z run:
June 4, 18Z run:
June 5, 06Z run:
June 5, 12Z run:
June 5, 18Z run:
June 6, 06Z run:
June 8, 06Z run:
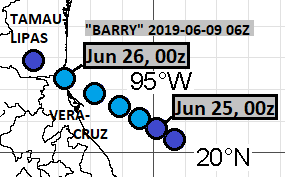
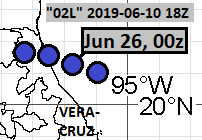
Ghost storm L#27
This corresponds closely to the trough in Gulf of Mexico, paralleling Texas coast, in the following synoptic chart.
June 9, 06Z run:
June 10, 18Z run:
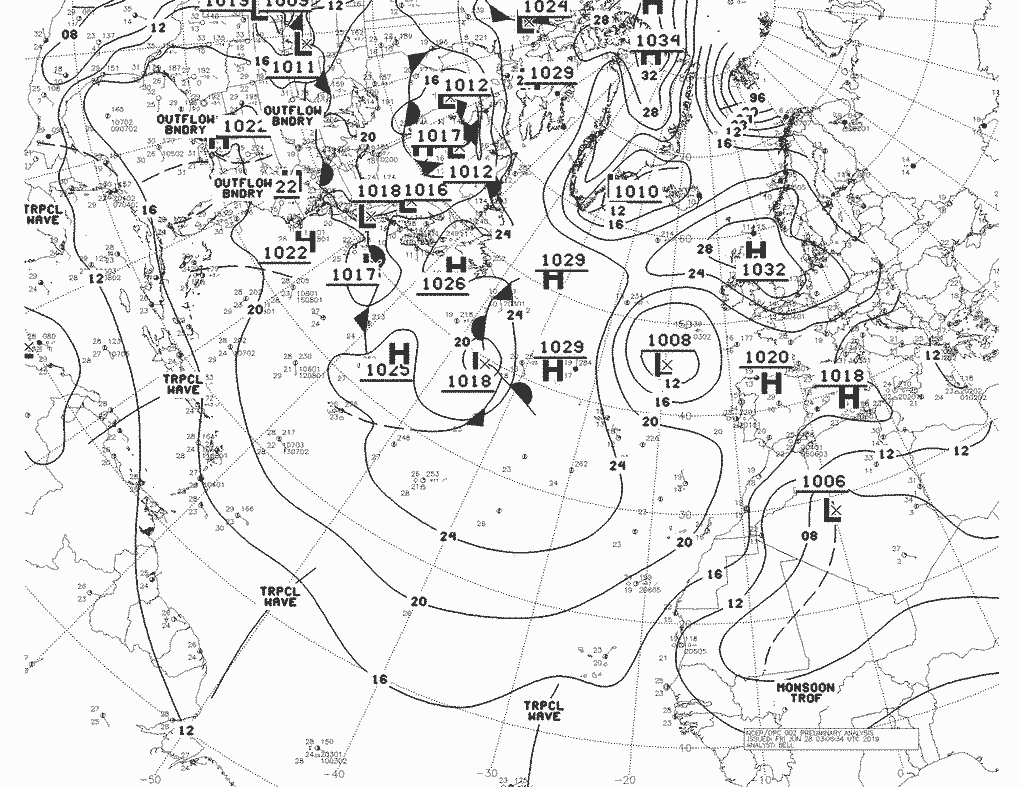
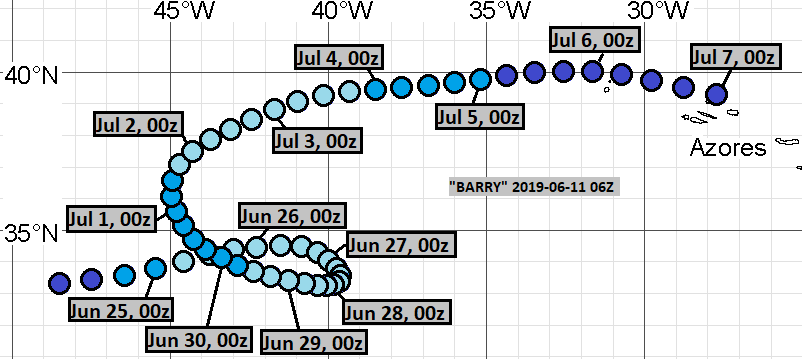
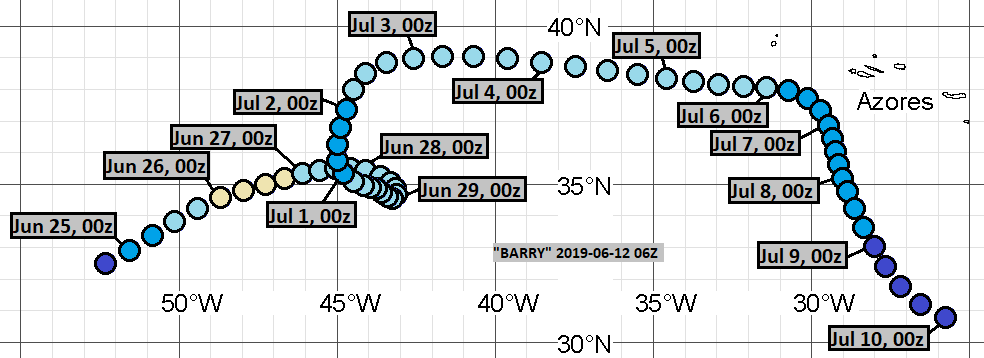
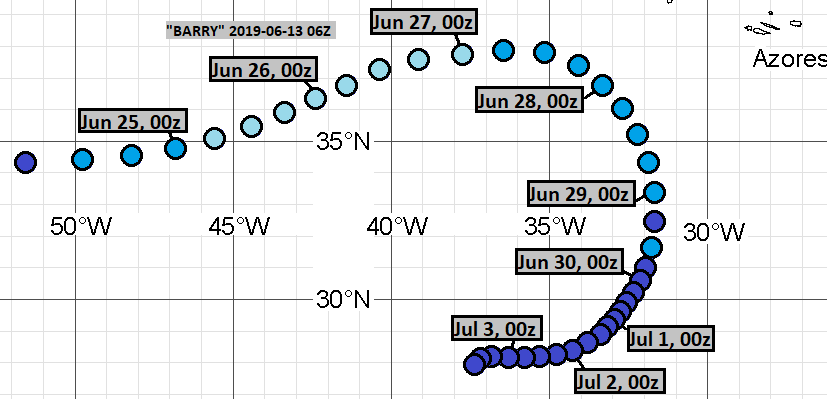
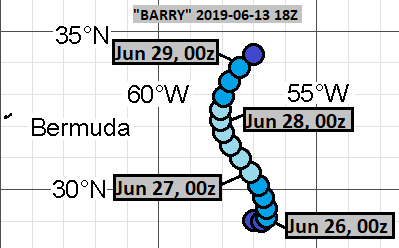
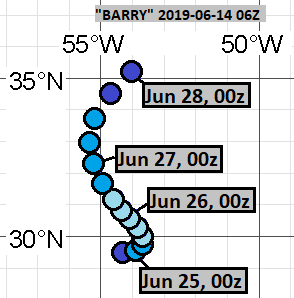
Ghost storm L#28
This is best identifiable with the 1018mbar low in Central Atlantic in the following synoptic chart.
June 11, 06Z run:
June 12, 06Z run:
June 12, 12Z run:
June 12, 18Z run:
June 13, 06Z run:
June 13, 18Z run:
June 14, 06Z run:
June 17, 06Z run:
June 18, 18Z run:
Ghost storm L#29
This is completely unidentifiable.
June 12, 06Z run:
June 12, 12Z run:
June 12, 18Z run:
June 13, 06Z run:
June 14, 06Z run:
June 15, 06Z run:
June 16, 12Z run:
June 16, 18Z run:
June 17, 12Z run:
June 18, 06Z run:
June 18, 18Z run:
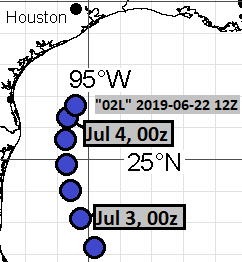
June 22, 12Z run:
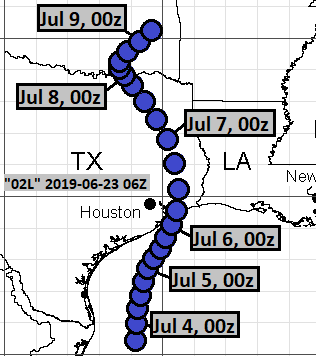
June 23, 06Z run:
Ghost storm L#30
This is identifiable with absolutely nothing.
June 18, 06Z run:
June 18, 18Z run:
June 19, 06Z run:
June 19, 12Z run:
June 19, 18Z run:
June 20, 06Z run:
June 23, 06Z run:
June 23, 12Z run:
June 23, 18Z run:
June 24, 18Z run:
June 25, 12Z run:
Ghost storm L#31
These tracks are completely detached from anything, that exists or has existed in reality.
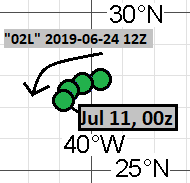
June 24, 12Z run:
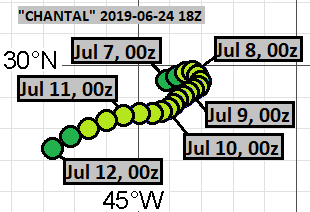
June 24, 18Z run:
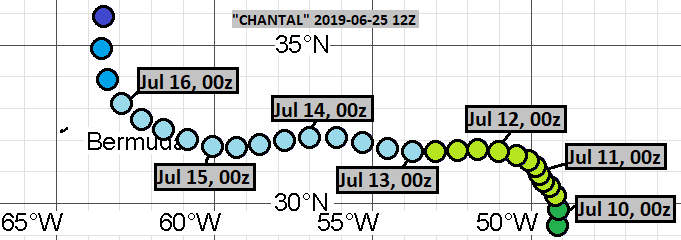
June 25, 12Z run:
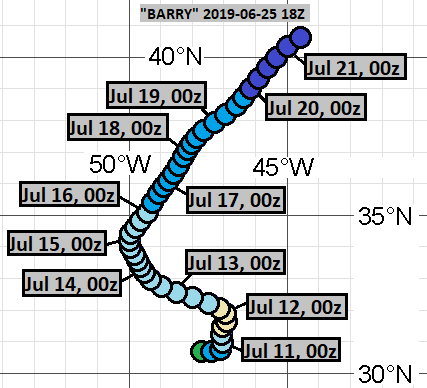
June 25, 18Z run:
June 26, 06Z run:
June 26, 12Z run:
June 27, 06Z run:
June 30, 18Z run:
Ghost storm L#32
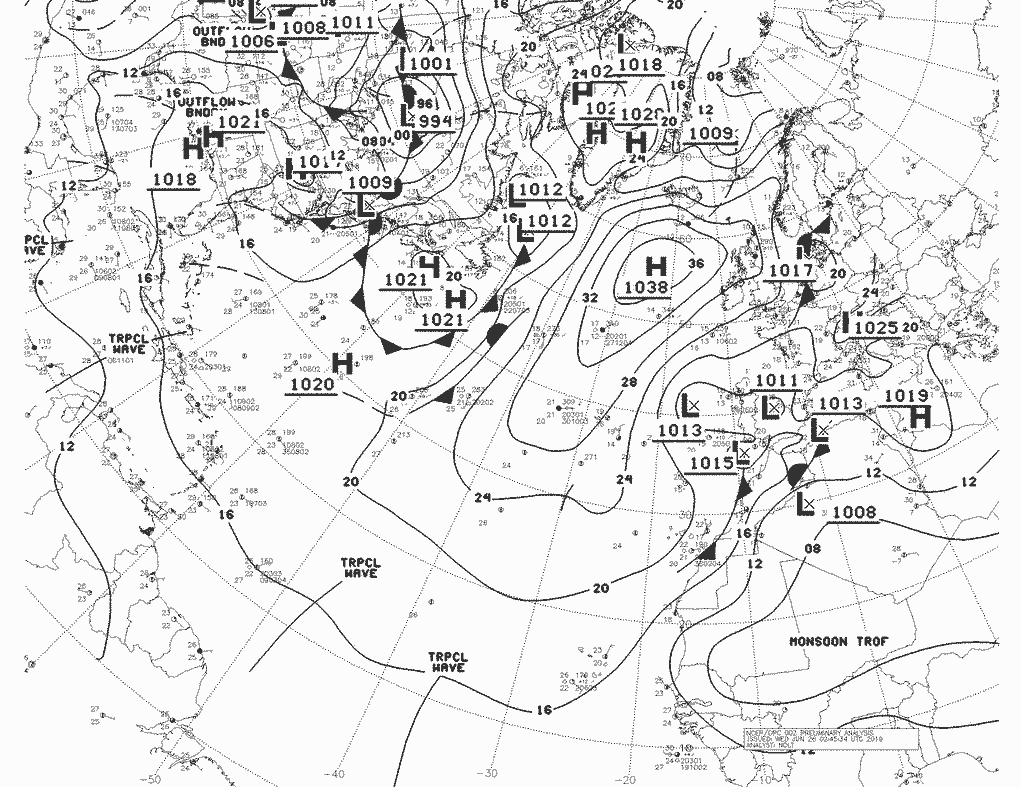
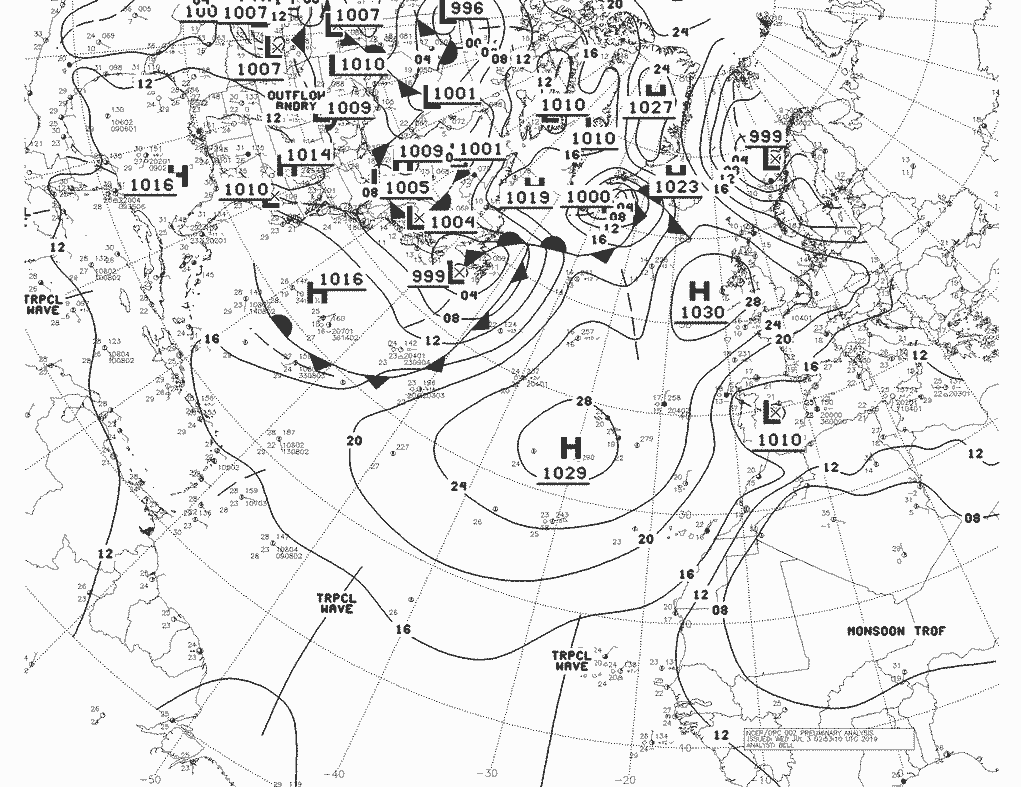
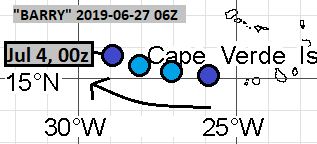
This lone track is identifiable with the tropical wave, which is near Cabo Verde Islands in the following synoptic chart.
June 27, 06Z run:
Ghost storm L#33
These inconsistent tracks with long lead time are not identifiable.
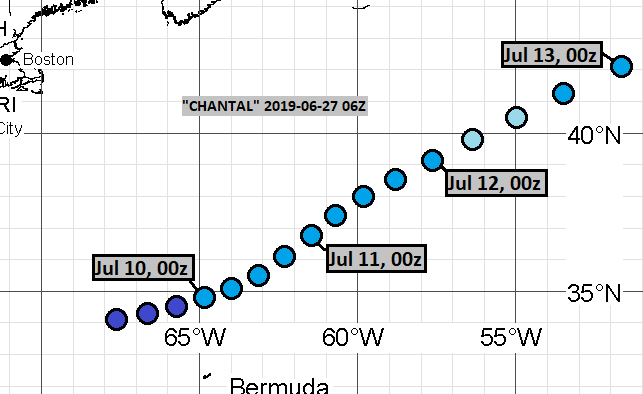
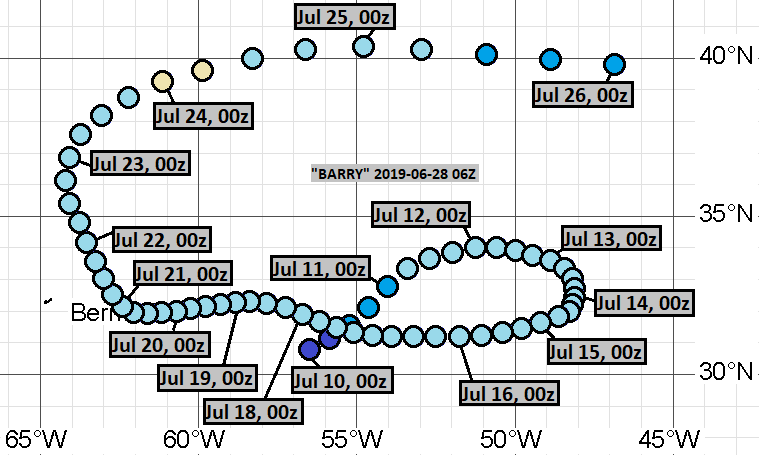
June 27, 06Z run:
June 28, 06Z run:
June 30, 12Z run:
July 2, 06Z run:
July 3, 06Z run:
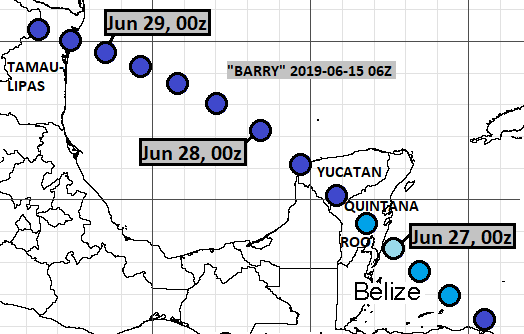
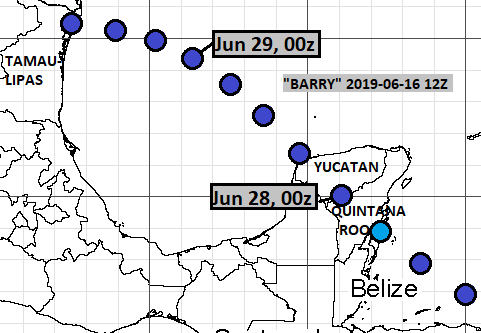
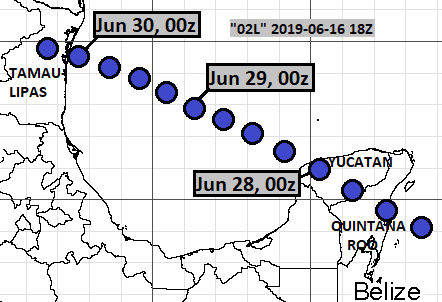
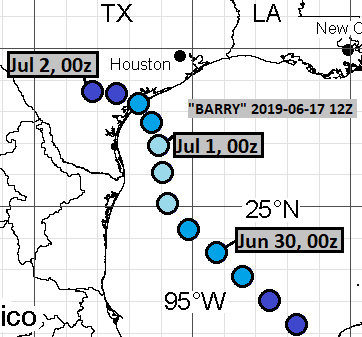
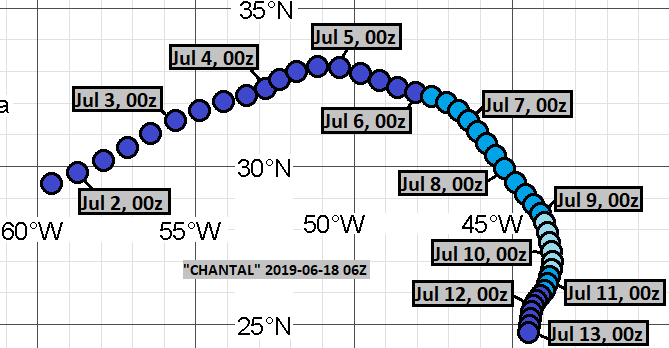
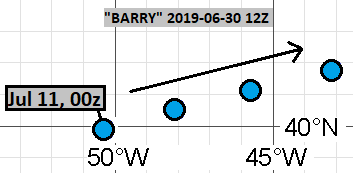
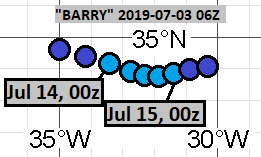
System L#34
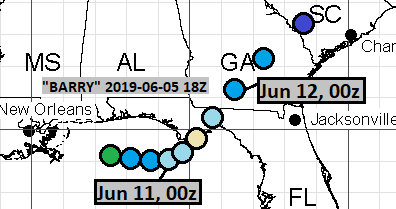
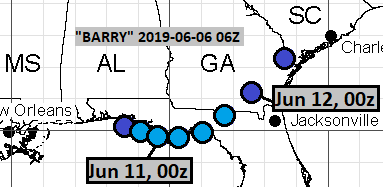
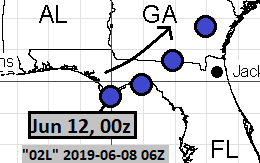
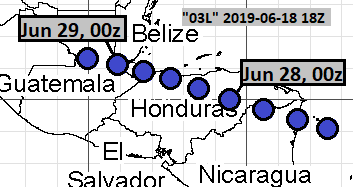
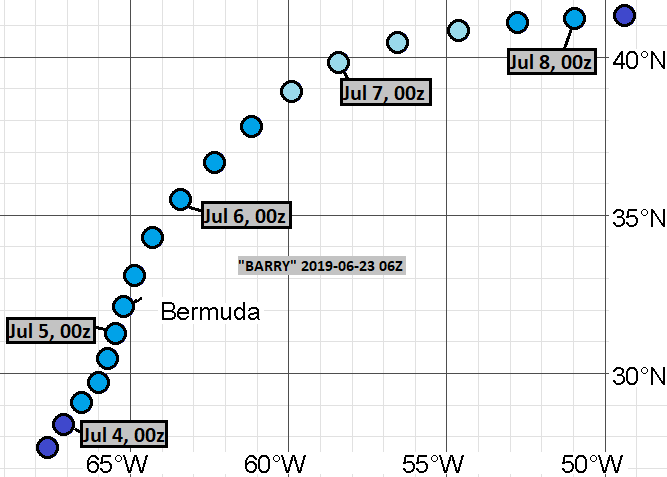
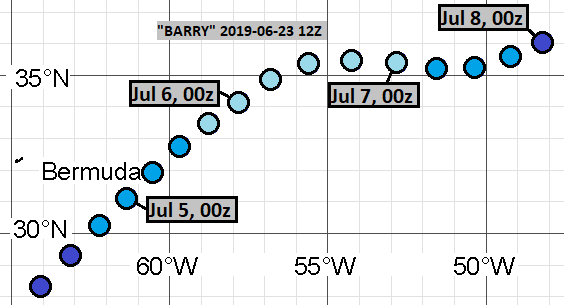
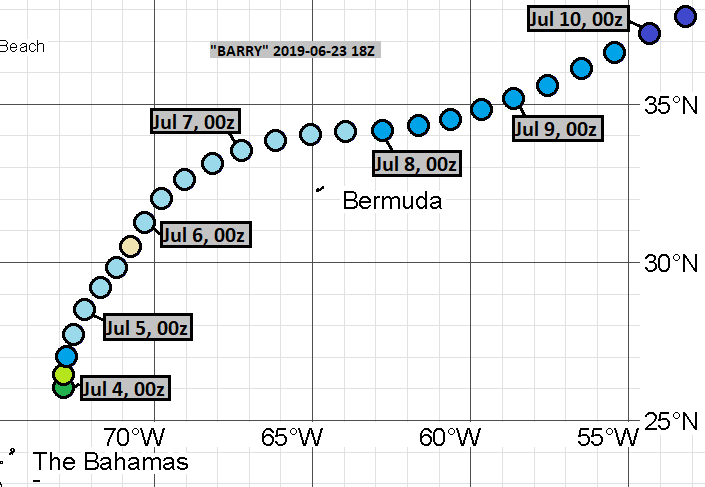
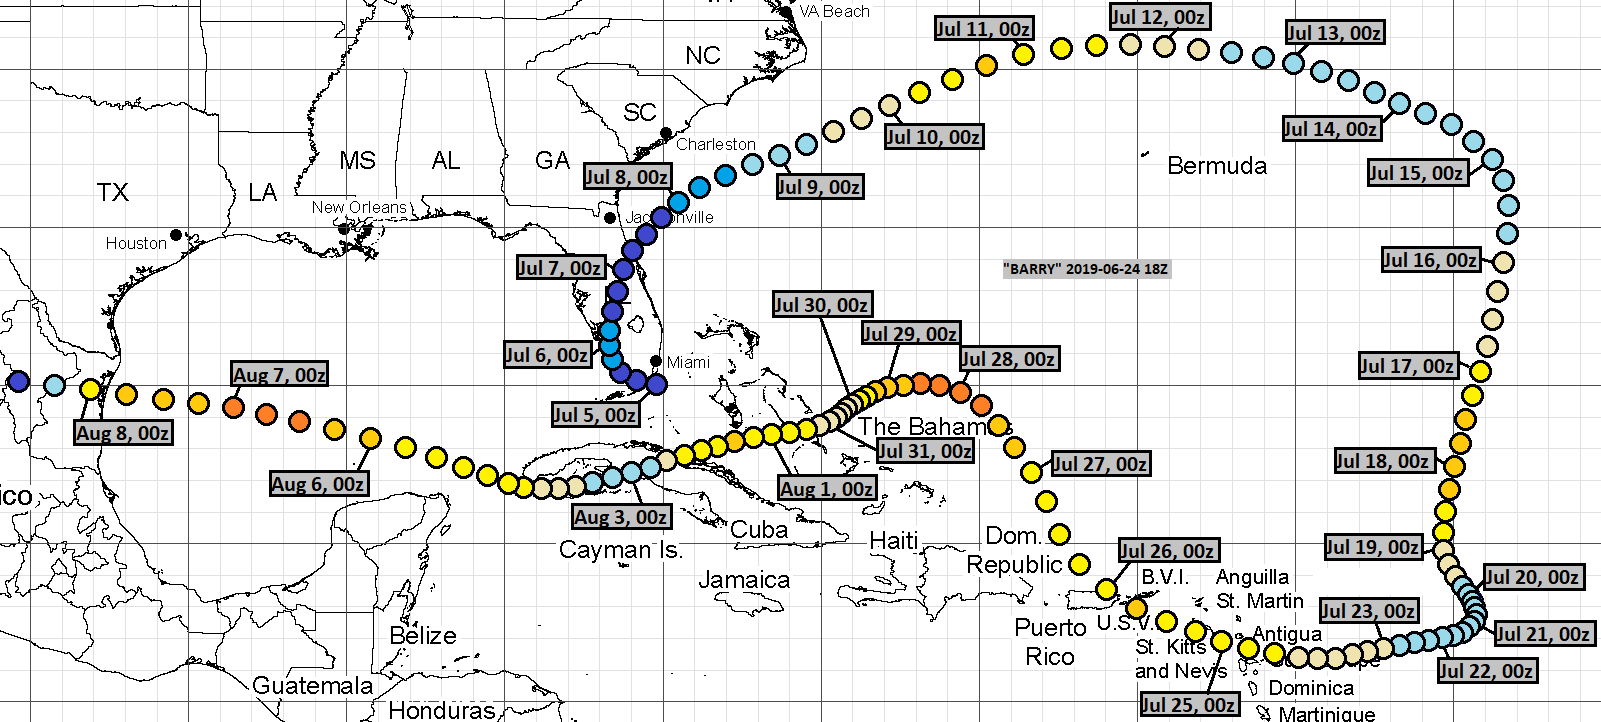
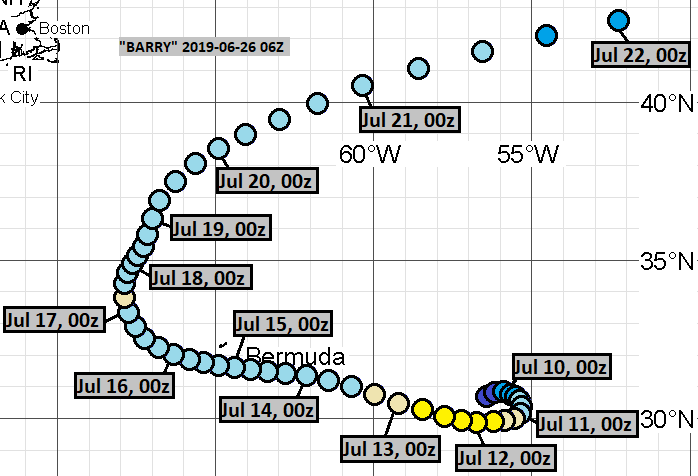
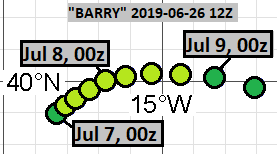
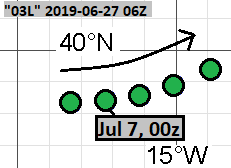
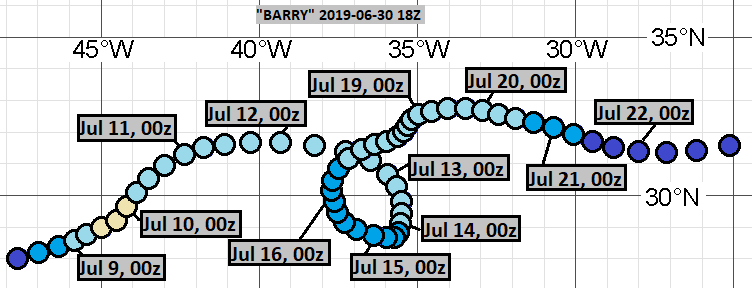
was not a ghost storm. Rather, it was TD 3.
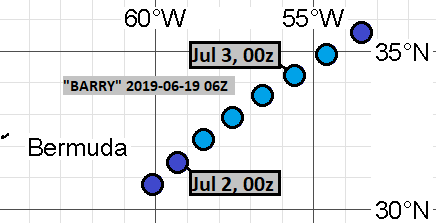
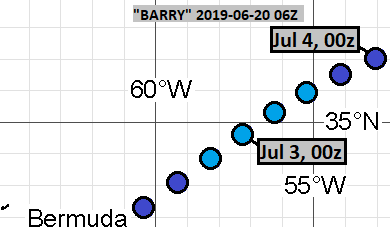
System L#35
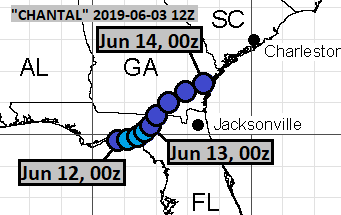
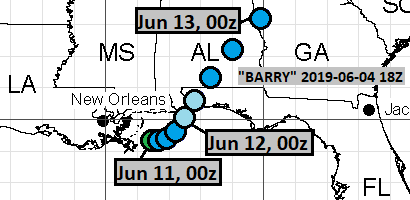
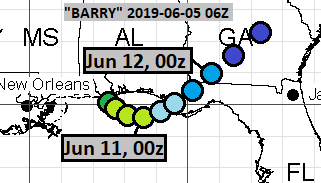
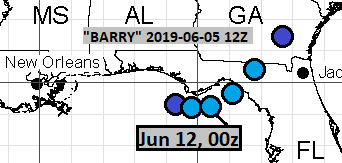
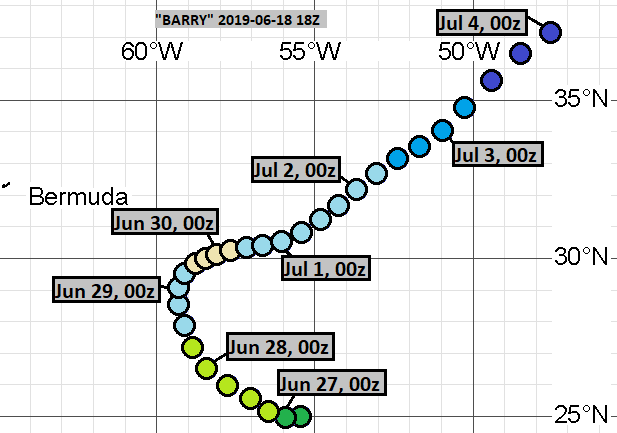
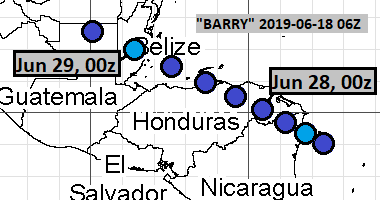
was not a ghost storm. Rather, it was Barry.
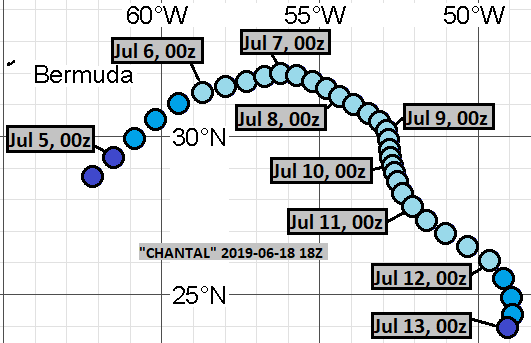
System L#36
was not a ghost storm. Rather, it was (also) TD 3.
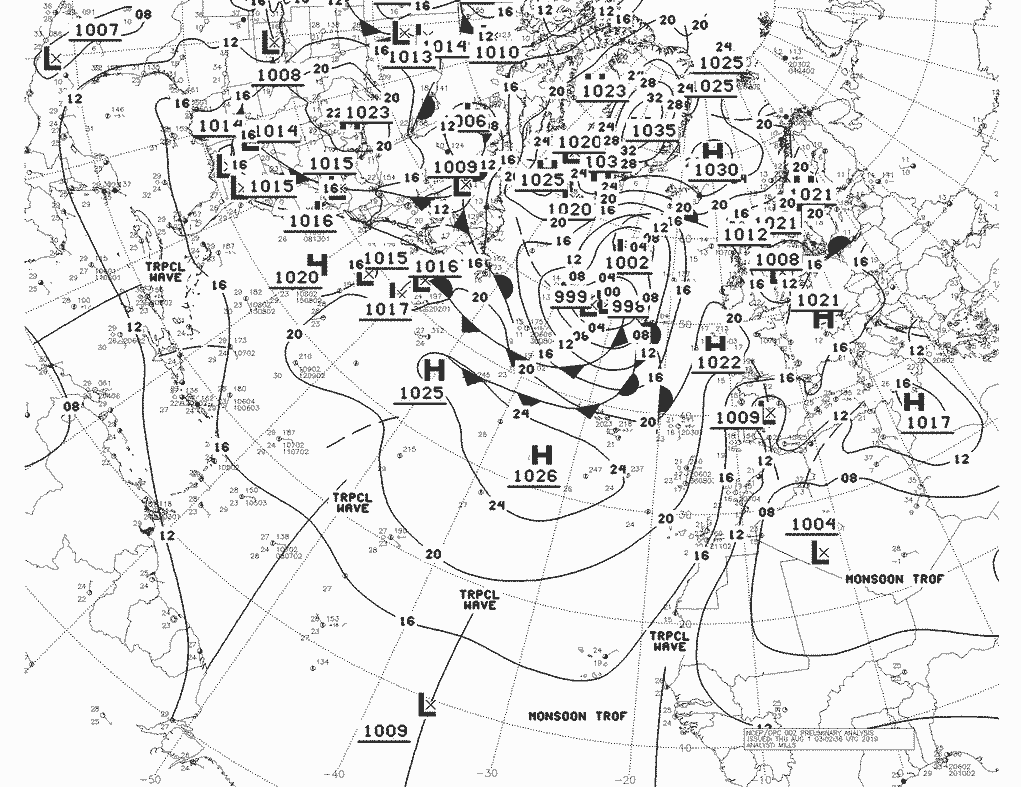
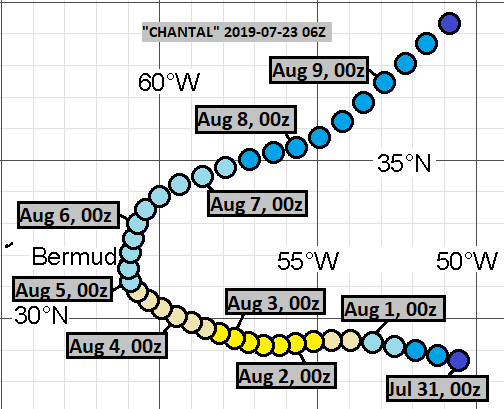
Ghost storm L#37
Despite differences between these tracks, the system is identifiable with a tropical wave, extending north from French Guiana / Brazil border in this synoptic chart.
July 23, 06Z run:
July 24, 06Z run:
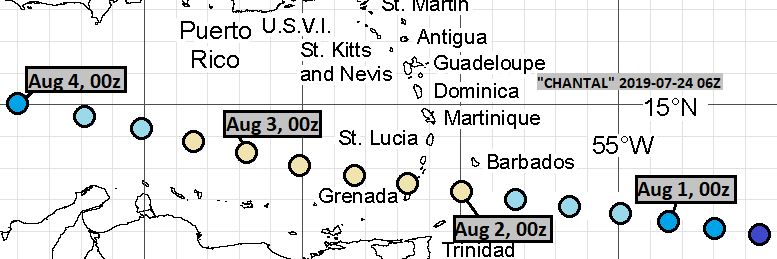
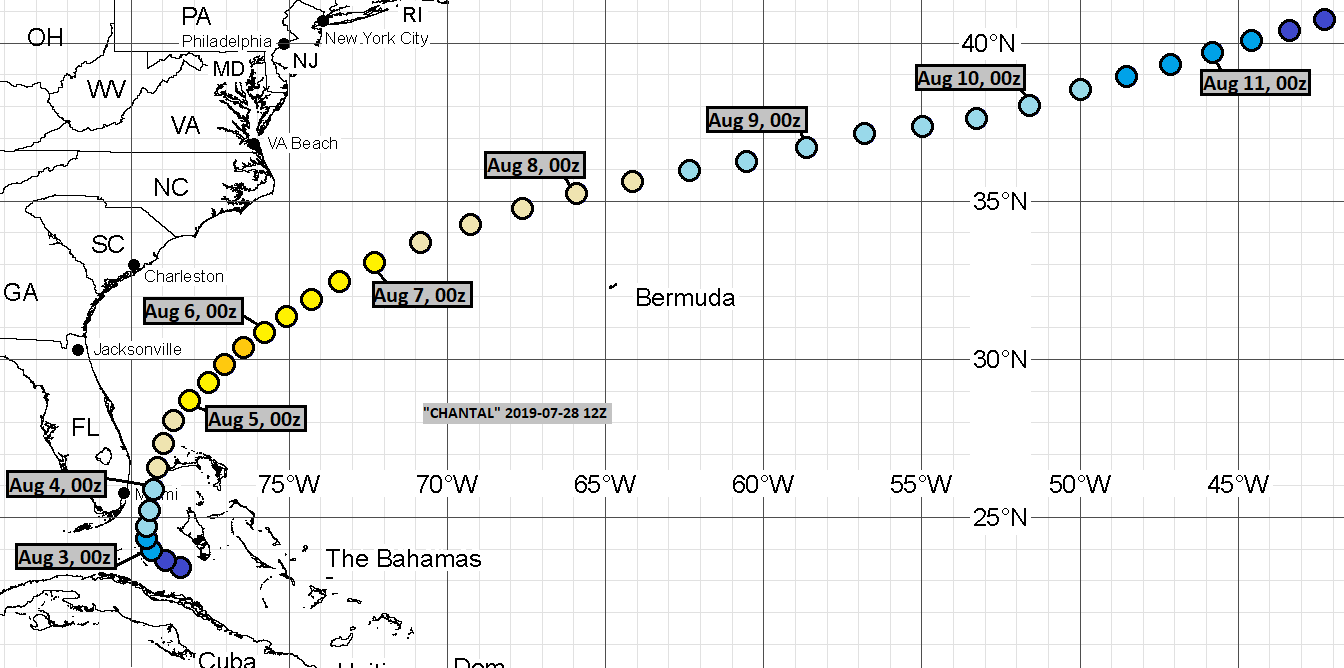
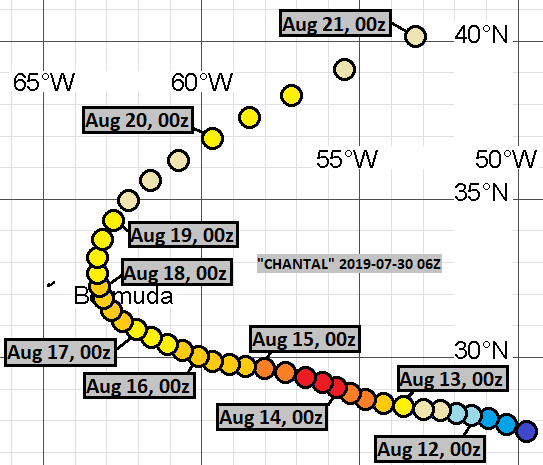
Ghost storm L#38
This system was mentioned by NHC in TWOs for many days, although at only 10%/20% at most.
July 28, 12Z run:
July 28, 18Z run:
Ghost storm L#39
These were just something bizarre. These continued in August.
July 29, 06Z run:
July 30, 06Z run:
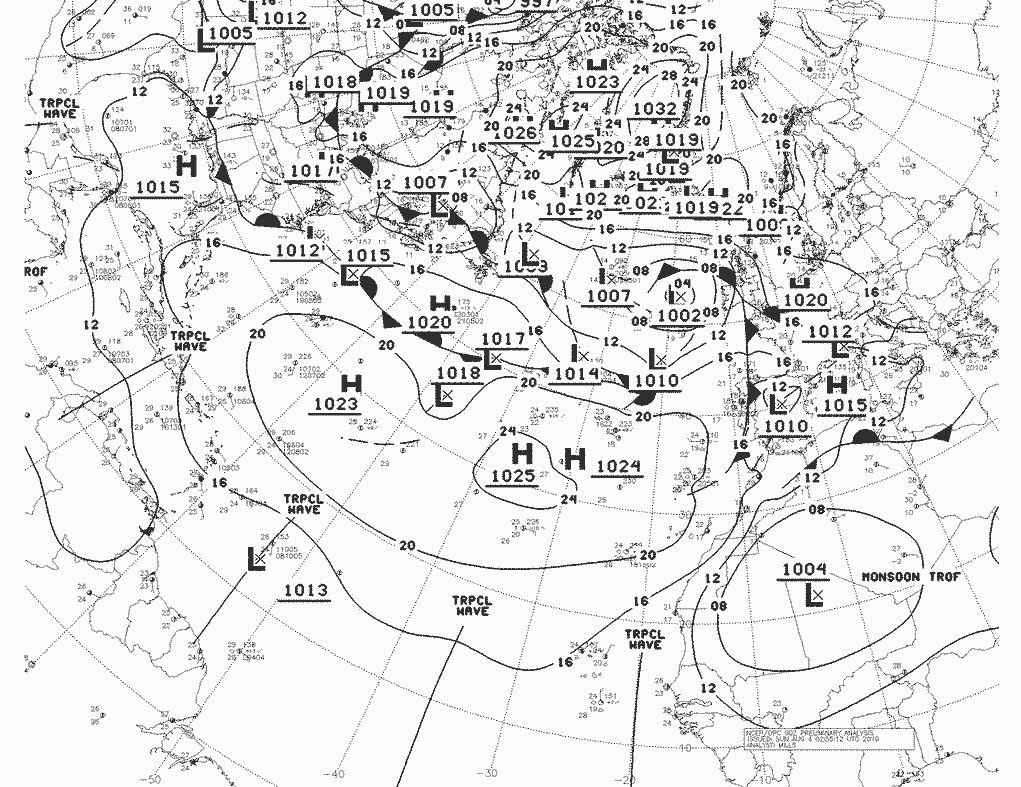
Ghost storm L#40
These are identifiable with a tropical wave, extending north of French Guiana in the following synoptic chart. These tracks continued in August.
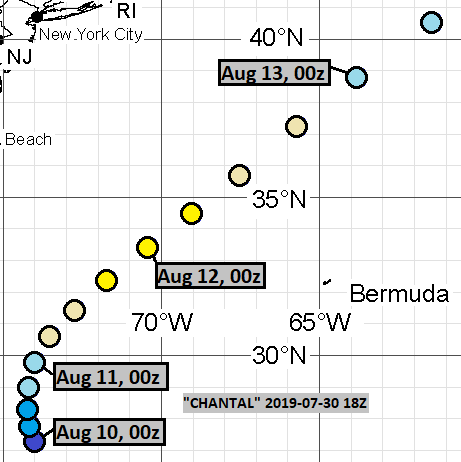
July 30, 18Z run:
July 31, 06Z run:























Comments
Post a Comment