Verification of tracks made of Barbara using GEFS mean fields
I made 13 tracks of Hurricane Barbara. Additionally, within 384
hours of cyclogenesis, there were 19 instances, when I missed
cyclogenesis entirely. There were two major gaps, when no cyclogenesis was expected. With the exception of the last track, the progression of precursor wave was estimated wrong, cyclogenesis was expected to happen too far east, and a sharp north turn was projected. As a result, position errors became huge at most lead times.
As of this analysis, best track positions are available June 28, 06Z thru July 8, 12Z, and as such, position comparisons are possible only for this timespan.
Getting out of the frame of East Pacific tracking map is considered equal to dissipation for the purpose of this verification.
Since I give only SSHS categories in my tracks, I don't calculate intensity errors in units of speed, but in categories. For this purpose, I define tropical or subtropical storms as "Category 0", tropical or subtropical depressions as "Category -1" and non-existence of a tropical or subtropical cyclone as "Category -2".
In the 13 tracks, formation times ranged between June 22, 00Z and July 1, 06Z. Average was June 28, 09Z and median was June 28, 18Z.
In the 32 cases (13 tracks and 19 complete misses), peak intensity ranged between Category -2 and Category 5. Average was Category -0.22 and median was Category -2.
In the 13 tracks, dissipation times ranged between June 28, 18Z and July 15, 00Z. Average was July 4, 17Z and median was July 4, 00Z.
At the lead time of 1 day (24 hours), there were 0 hits, 1 false detection and 0 misses. 1 available position comparison produces an average error of 131 nautical miles.
At the lead time of 2 days (48 hours), there were 0 hits, 1 false detection and 0 misses. 1 available position comparison produces an average error of 110 nautical miles.
At the lead time of 3 days (72 hours), there were 1 hit, 0 false detections and 0 misses. 1 available position comparison produces an average error of 57 nautical miles.
At the lead time of 4 days (96 hours), there were 1 hit, 0 false detections and 2 misses. 1 available position comparison produces an average error of 89 nautical miles.
At the lead time of 5 days (120 hours), there were 1 hit, 0 false detections and 5 misses. 1 available position comparison produces an average error of 234 nautical miles.
At the lead time of 6 days (144 hours), there were 1 hit, 0 false detections and 8 misses. 1 available position comparison produces an average error of 390 nautical miles.
At the lead time of 7 days (168 hours), there were 1 hit, 1 false detection and 11 misses. 2 available position comparisons produce an average error of 370 nautical miles.
At the lead time of 8 days (192 hours), there were 5 hits, 3 false detections and 9 misses. 8 available position comparisons produce an average error of 625 nautical miles.
At the lead time of 9 days (216 hours), there were 4 hits, 5 false detections and 9 misses. 9 available position comparisons produce an average error of 740 nautical miles.
At the lead time of 10 days (240 hours), there were 5 hits, 4 false detections and 8 misses. 9 available position comparisons produce an average error of 785 nautical miles.
At the lead time of 11 days (264 hours), there were 6 hits, 2 false detections and 6 misses. 7 available position comparisons produce an average error of 907 nautical miles.
At the lead time of 12 days (288 hours), there were 7 hits, 1 false detection and 6 misses. 7 available position comparisons produce an average error of 1037 nautical miles.
At the lead time of 13 days (312 hours), there were 4 hits, 2 false detections and 9 misses. 4 available position comparisons produce an average error of 1098 nautical miles.
At the lead time of 14 days (336 hours), there were 2 hits, 5 false detections and 12 misses. 3 available position comparisons produce an average error of 1321 nautical miles.
At the lead time of 15 days (360 hours), there were 1 hit, 4 false detections and 13 misses. 1 available position comparison produces an average error of 1185 nautical miles.
At the lead time of 16 days (384 hours), there were 0 hits, 4 false detections and 13 misses. 2 available position comparisons produce an average error of 443 nautical miles.
Here are the tracks once again.
June 8, 12Z run:

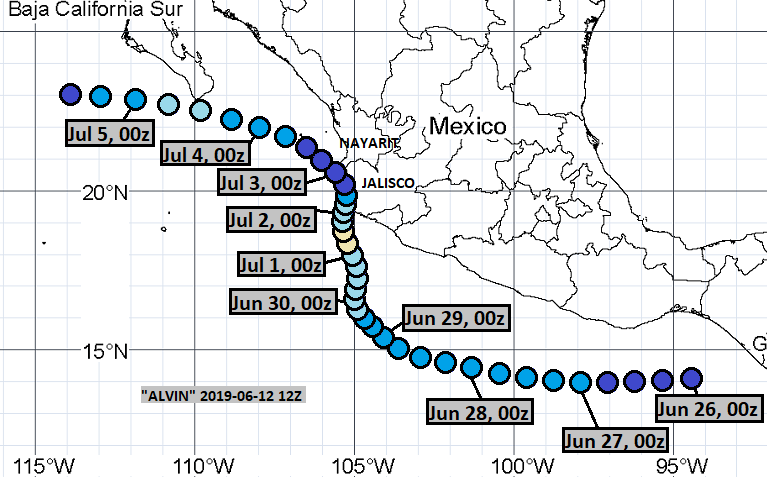
June 12, 12Z run:
June 12, 18Z run:

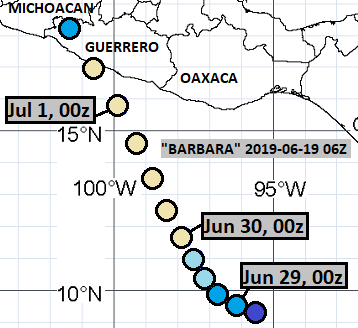
June 19, 06Z run:
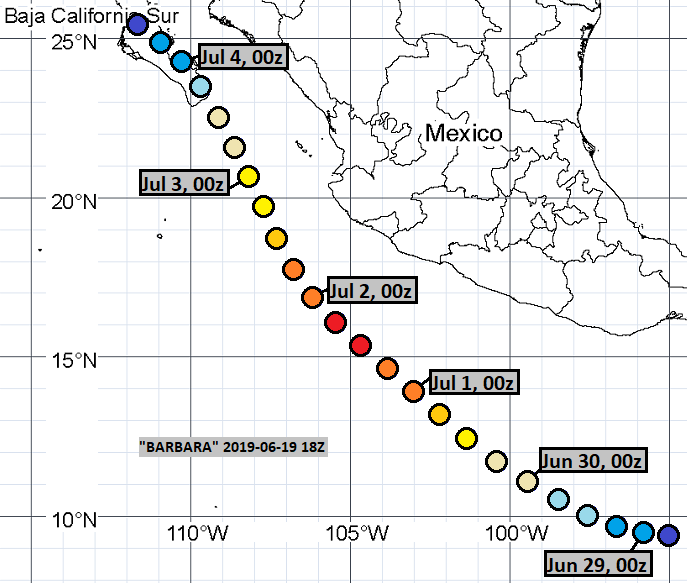
June 19, 18Z run:
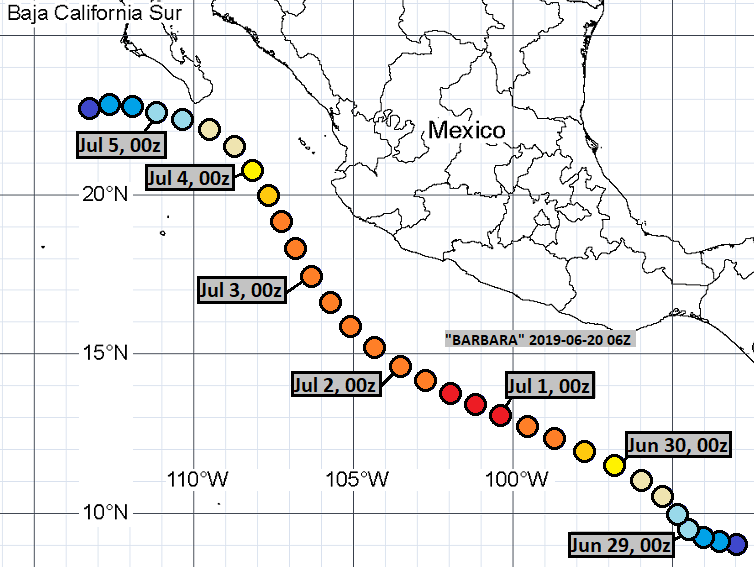
June 20, 06Z run:
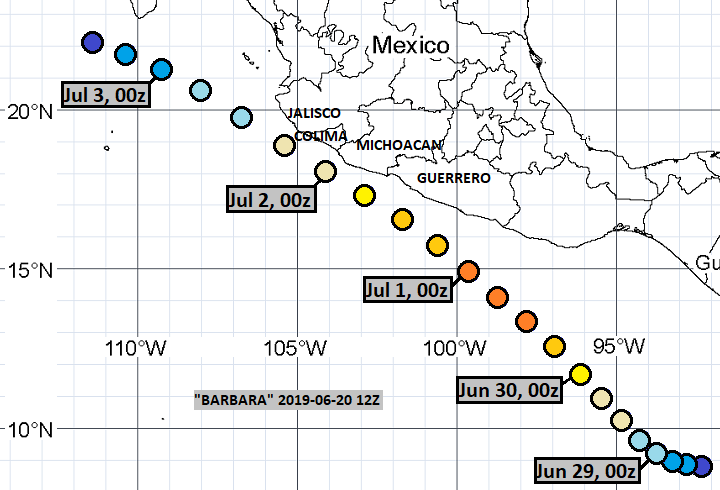
June 20, 12Z run:
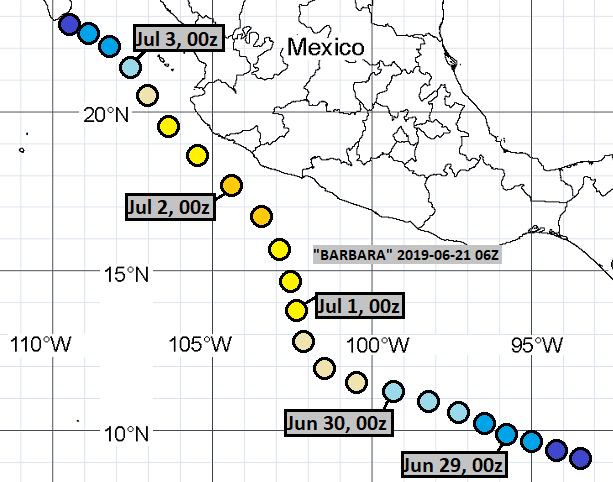
June 21, 06Z run:
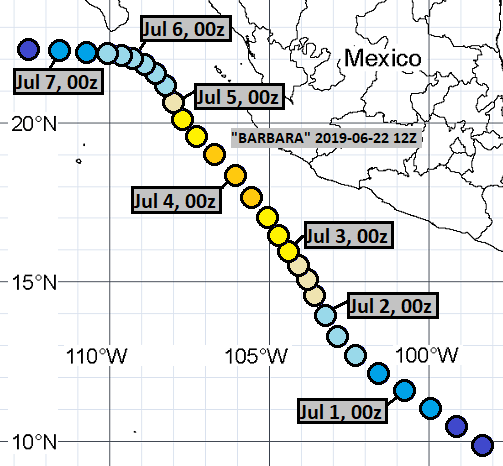
June 22, 12Z run:
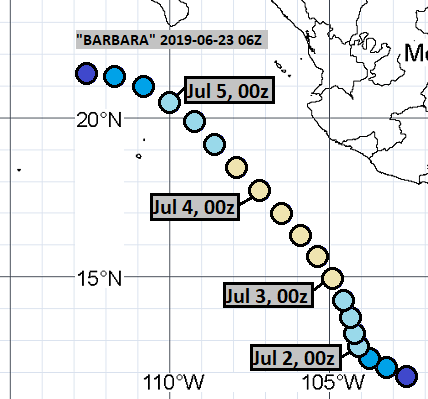
June 23, 06Z run:
June 23, 12Z run:
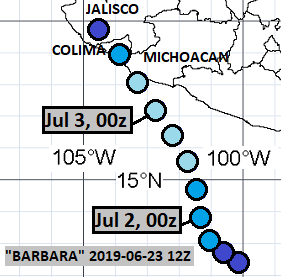
June 23, 18Z run:
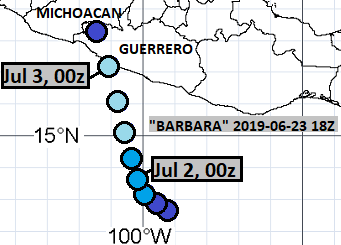
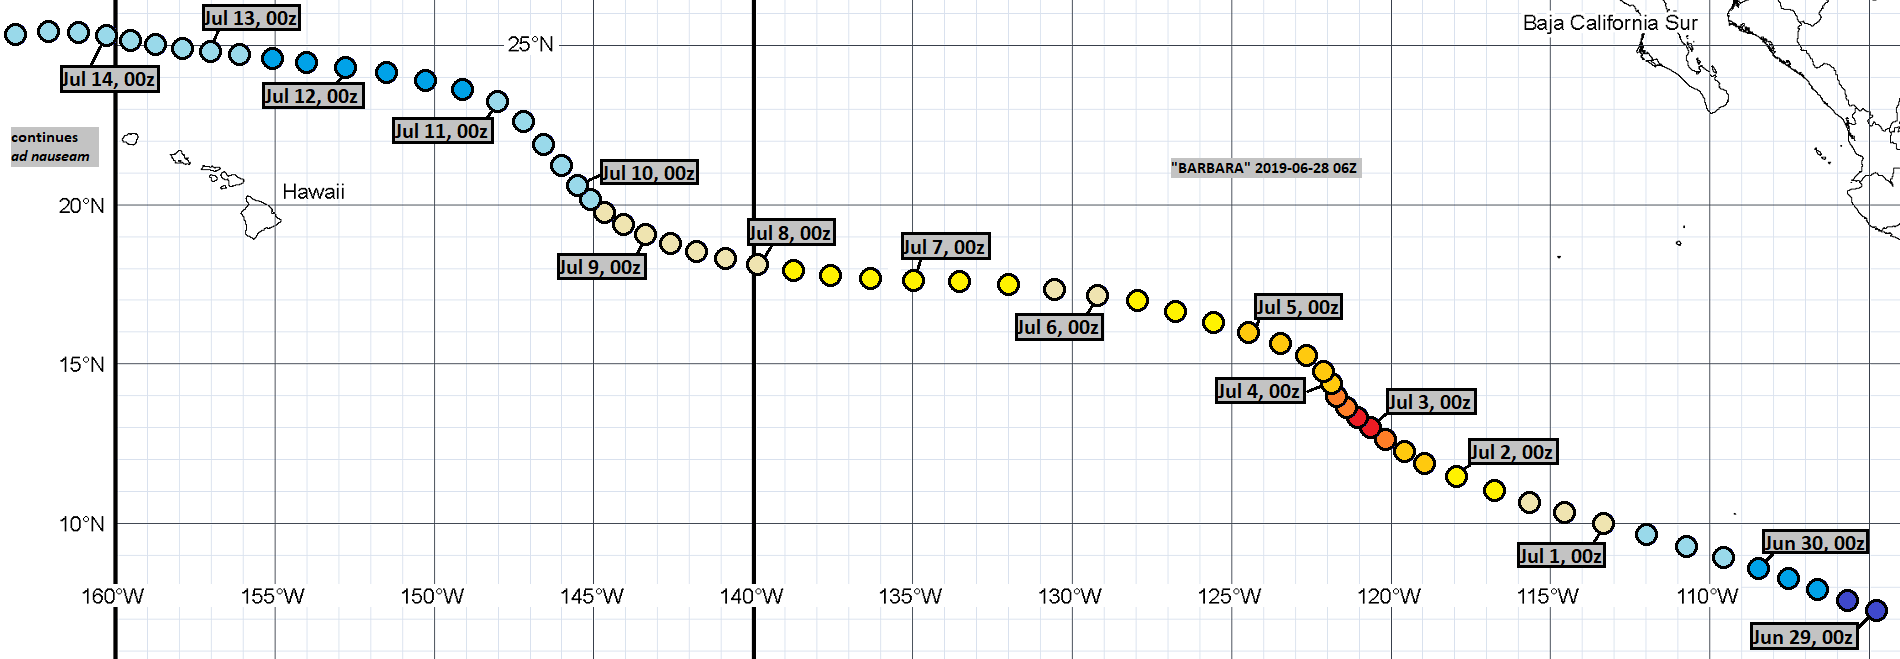
June 28, 06Z run:
The complete misses were from following runs:
June 15, 06Z
June 16, 12Z
June 16, 18Z
June 17, 06Z
June 17, 12Z
June 17, 18Z
June 18, 06Z
June 18, 12Z
June 18, 18Z
June 19, 12Z
June 24, 06Z
June 24, 12Z
June 24, 18Z
June 25, 06Z
June 25, 12Z
June 25, 18Z
June 26, 06Z
June 26, 12Z
June 27, 06Z
As of this analysis, best track positions are available June 28, 06Z thru July 8, 12Z, and as such, position comparisons are possible only for this timespan.
Getting out of the frame of East Pacific tracking map is considered equal to dissipation for the purpose of this verification.
Since I give only SSHS categories in my tracks, I don't calculate intensity errors in units of speed, but in categories. For this purpose, I define tropical or subtropical storms as "Category 0", tropical or subtropical depressions as "Category -1" and non-existence of a tropical or subtropical cyclone as "Category -2".
In the 13 tracks, formation times ranged between June 22, 00Z and July 1, 06Z. Average was June 28, 09Z and median was June 28, 18Z.
In the 32 cases (13 tracks and 19 complete misses), peak intensity ranged between Category -2 and Category 5. Average was Category -0.22 and median was Category -2.
In the 13 tracks, dissipation times ranged between June 28, 18Z and July 15, 00Z. Average was July 4, 17Z and median was July 4, 00Z.
At the lead time of 1 day (24 hours), there were 0 hits, 1 false detection and 0 misses. 1 available position comparison produces an average error of 131 nautical miles.
At the lead time of 2 days (48 hours), there were 0 hits, 1 false detection and 0 misses. 1 available position comparison produces an average error of 110 nautical miles.
At the lead time of 3 days (72 hours), there were 1 hit, 0 false detections and 0 misses. 1 available position comparison produces an average error of 57 nautical miles.
At the lead time of 4 days (96 hours), there were 1 hit, 0 false detections and 2 misses. 1 available position comparison produces an average error of 89 nautical miles.
At the lead time of 5 days (120 hours), there were 1 hit, 0 false detections and 5 misses. 1 available position comparison produces an average error of 234 nautical miles.
At the lead time of 6 days (144 hours), there were 1 hit, 0 false detections and 8 misses. 1 available position comparison produces an average error of 390 nautical miles.
At the lead time of 7 days (168 hours), there were 1 hit, 1 false detection and 11 misses. 2 available position comparisons produce an average error of 370 nautical miles.
At the lead time of 8 days (192 hours), there were 5 hits, 3 false detections and 9 misses. 8 available position comparisons produce an average error of 625 nautical miles.
At the lead time of 9 days (216 hours), there were 4 hits, 5 false detections and 9 misses. 9 available position comparisons produce an average error of 740 nautical miles.
At the lead time of 10 days (240 hours), there were 5 hits, 4 false detections and 8 misses. 9 available position comparisons produce an average error of 785 nautical miles.
At the lead time of 11 days (264 hours), there were 6 hits, 2 false detections and 6 misses. 7 available position comparisons produce an average error of 907 nautical miles.
At the lead time of 12 days (288 hours), there were 7 hits, 1 false detection and 6 misses. 7 available position comparisons produce an average error of 1037 nautical miles.
At the lead time of 13 days (312 hours), there were 4 hits, 2 false detections and 9 misses. 4 available position comparisons produce an average error of 1098 nautical miles.
At the lead time of 14 days (336 hours), there were 2 hits, 5 false detections and 12 misses. 3 available position comparisons produce an average error of 1321 nautical miles.
At the lead time of 15 days (360 hours), there were 1 hit, 4 false detections and 13 misses. 1 available position comparison produces an average error of 1185 nautical miles.
At the lead time of 16 days (384 hours), there were 0 hits, 4 false detections and 13 misses. 2 available position comparisons produce an average error of 443 nautical miles.
Here are the tracks once again.
June 8, 12Z run:
June 12, 12Z run:
June 12, 18Z run:
June 19, 06Z run:
June 19, 18Z run:
June 20, 06Z run:
June 20, 12Z run:
June 21, 06Z run:
June 22, 12Z run:
June 23, 06Z run:
June 23, 12Z run:
June 23, 18Z run:
June 28, 06Z run:
The complete misses were from following runs:
June 15, 06Z
June 16, 12Z
June 16, 18Z
June 17, 06Z
June 17, 12Z
June 17, 18Z
June 18, 06Z
June 18, 12Z
June 18, 18Z
June 19, 12Z
June 24, 06Z
June 24, 12Z
June 24, 18Z
June 25, 06Z
June 25, 12Z
June 25, 18Z
June 26, 06Z
June 26, 12Z
June 27, 06Z

Comments
Post a Comment