Verification of tracks made of Jimena
I made five tracks of Tropical Storm Jimena,
before it was
assessed as
a tropical cyclone for the first time. I made three more tracks after the first cyclogenesis.
Additionally, within 504 hours of the first cyclogenesis, there were fourteen instances,
when I missed cyclogenesis entirely.
As of this analysis, best track positions are available July 25, 12Z
thru August 8, 00Z, and as such, position comparisons are possible only
for this timespan.
Since I give only SSHS categories in my tracks, I don't
calculate intensity errors in units of speed, but in categories. For
this purpose, I define tropical or subtropical storms as "Category 0", tropical
or subtropical depressions as "Category -1" and non-existence of a tropical or subtropical cyclone as
"Category -2".
In the five tracks (made before operationally recognized initial cyclogenesis), formation times ranged between July 29, 00Z and August 1,
00Z. Average was July 31, 05Z and median was July 31, 21Z.
In the twenty-two cases (8 tracks, before the tracks and data agreed,
that tropical storm would remain the peak intensity, and 14 complete
misses), peak intensity ranged between Category -2 and Category 1.
Average was Category -1.18 and median was Category -2.
In the eight tracks (made before operationally recognized final degeneration), dissipation times ranged between August 3, 18Z
and August 7, 06Z. Average was August 5, 05Z and median was August 4, 21Z.
At the lead time of 1 day (24 hours), there were 1 hit, 1 false detection and 1 miss. 3 available position comparisons produce an average error of 59 nautical miles.
At the lead time of 2 days (48 hours), there were 2 hits, 4 false detections and 1 miss. 5 available position comparisons produce an average error of 65 nautical miles.
At the lead time of 3 days (72 hours), there were 2 hits, 3 false detections and 1 miss. 5 available position comparisons produce an average error of 127 nautical miles.
At the lead time of 4 days (96 hours), there were 2 hits, 2 false detections and 2 misses. 4 available position comparisons produce an average error of 204 nautical miles.
At the lead time of 5 days (120 hours), there were 1 hit, 4 false detections and 1 miss. 5 available position comparisons produce an average error of 260 nautical miles.
At the lead time of 6 days (144 hours), there were 0 hits, 4 false detections and 3 misses. 4 available position comparisons produce an average error of 340 nautical miles.
At the lead time of 7 days (168 hours), there were 0 hits, 3 false detections and 4 misses. 3 available position comparisons produce an average error of 420 nautical miles.
At the lead time of 8 days (192 hours), there were 0 hits, 1 false detection and 5 misses. 1 available position comparison produces an average error of 448 nautical miles.
At the lead time of 9 days (216 hours), there were 0 hits, 0 false detections and 5 misses. No available position comparisons.
At the lead time of 10 days (240 hours), there were 0 hits, 0 false detections and 4 misses. No available position comparisons.
At the lead time of 11 days (264 hours), there were 0 hits, 0 false detections and 5 misses. No available position comparisons.
At the lead time of 12 days (288 hours), there were 0 hits, 0 false detections and 4 misses. No available position comparisons.
At the lead time of 13 days (312 hours), there were 0 hits, 0 false detections and 4 misses. No available position comparisons.
At the lead time of 14 days (336 hours), there were 0 hits, 0 false detections and 3 misses. No available position comparisons.
At the lead time of 15 days (360 hours), there were 0 hits, 0 false detections and 2 misses. No available position comparisons.
At the lead time of 16 days (384 hours), there were 0 hits, 0 false detections and 4 misses. No available position comparisons.
At the lead time of 17 days (408 hours), there were 0 hits, 0 false detections and 2 misses. No available position comparisons.
At the lead time of 18 days (432 hours), there were 0 hits, 0 false detections and 3 misses. No available position comparisons.
At the lead time of 19 days (456 hours), there were 0 hits, 0 false detections and 2 misses. No available position comparisons.
At the lead time of 20 days (480 hours), there were 0 hits, 0 false detections and 3 misses. No available position comparisons.
At the lead time of 21 days (504 hours), there were 0 hits, 0 false detections and 2 misses. No available position comparisons.
Circle coloration scheme

Here are the tracks once again.
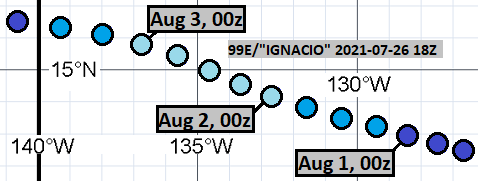
July 26, 18Z:
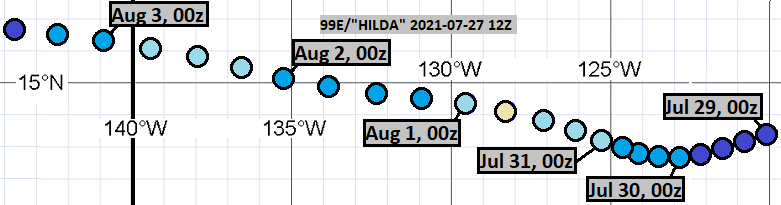
July 27, 12Z:
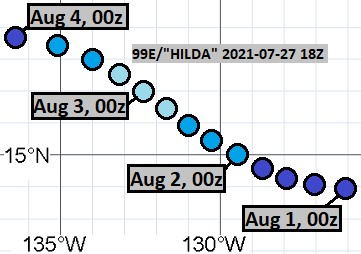
July 27, 18Z:
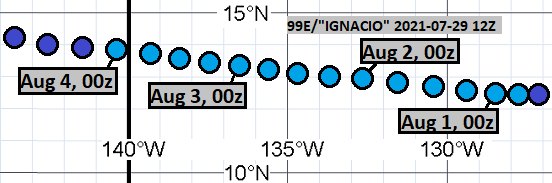
July 29, 12Z:
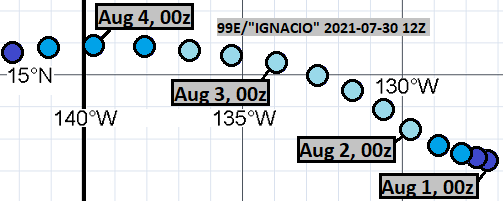
July 30, 12Z:
August 1, 18Z:

August 3, 12Z:

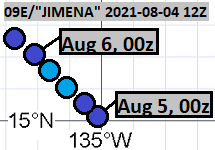
August 4, 12Z:
The complete misses were from the following model cycles:
July 10, 18Z
July 11, 12Z
July 12, 18Z
July 13, 12Z
July 15, 12Z
July 17, 12Z
July 19, 18Z
July 20, 12Z
July 21, 12Z
July 22, 18Z
July 23, 06Z
July 24, 00Z
July 24, 18Z
July 25, 12Z

How to make money from betting on football - Work Tomake Money
ReplyDeleteIf you're หารายได้เสริม having problems finding a winning bet online for the day of your aprcasino choosing, poormansguidetocasinogambling then there jancasino are plenty of opportunities available right bsjeon here.