Verification of tracks made on Isaac using GEFS mean fields
I made 33 tracks about Hurricane Isaac. Additionally, within 384
hours of cyclogenesis, there were two instances, when I missed
cyclogenesis entirely. Peak intensity was generally assumed too high, and Isaac was also expected to be more long-lived. Cyclogenesis was projected to happen too far east and too early. Track forecast was excellent in long range.
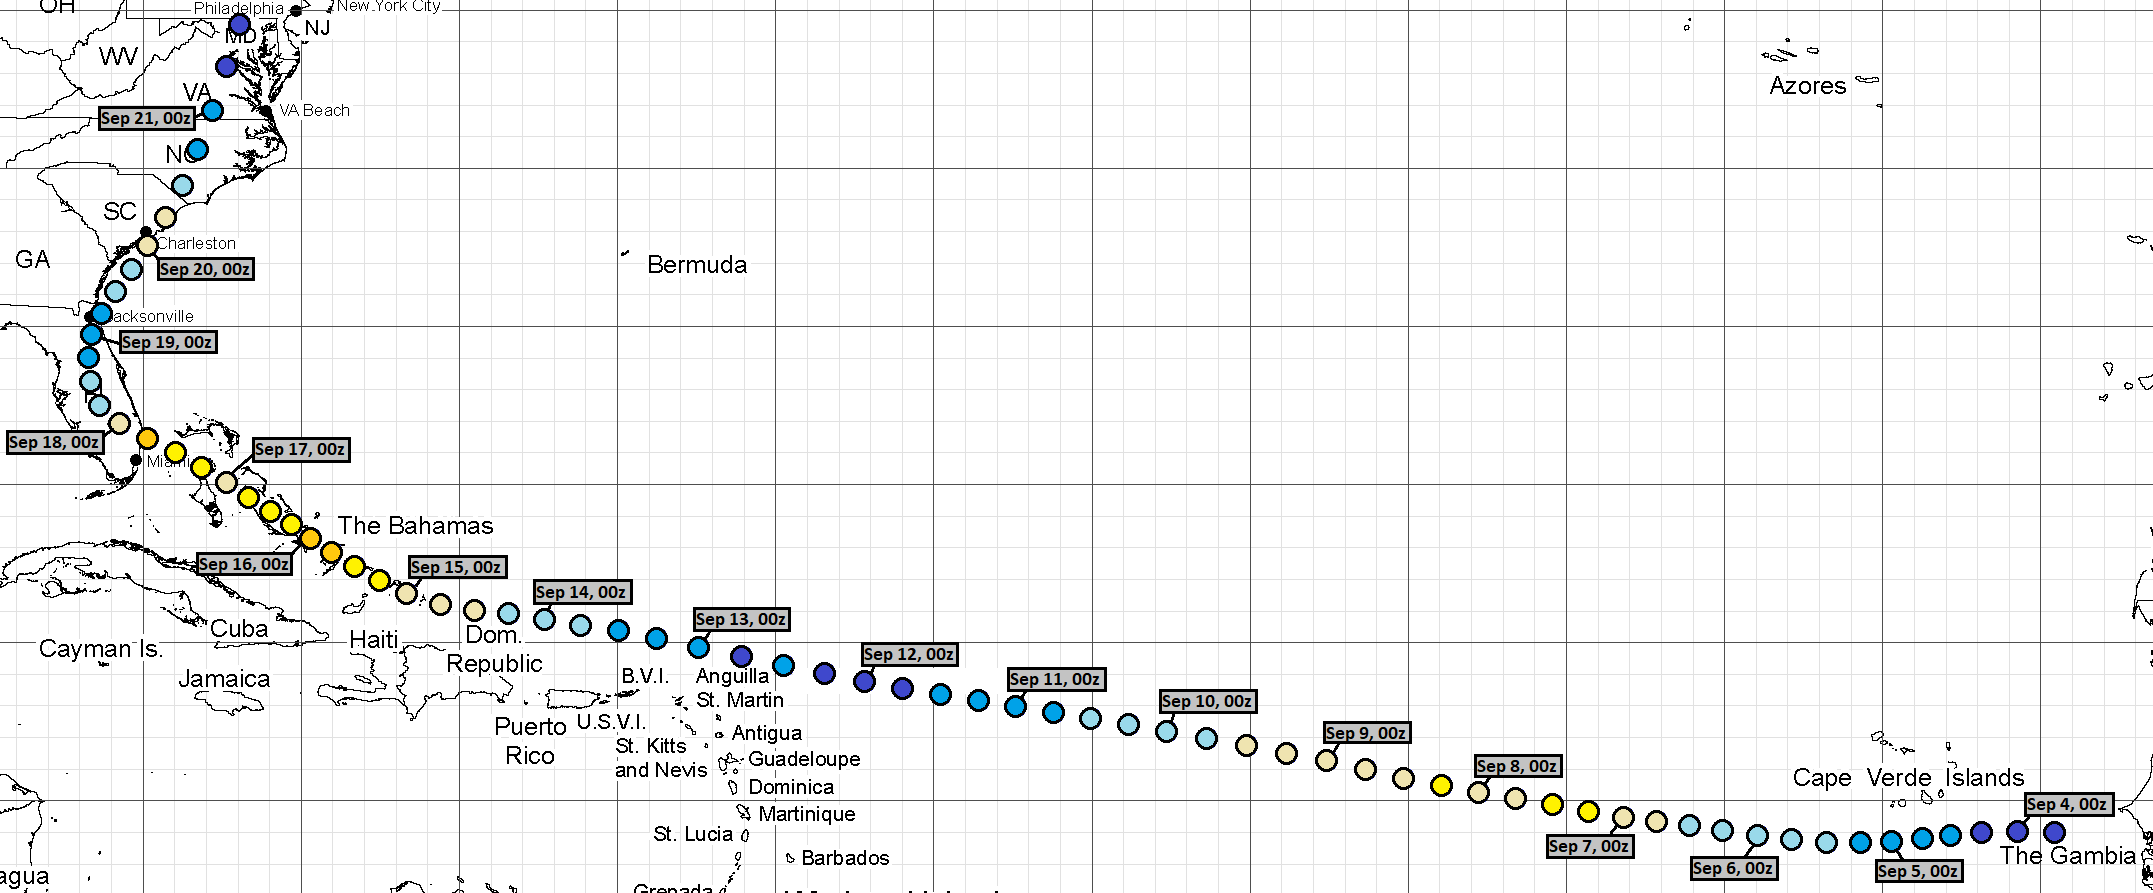
As of this analysis, best track positions are available September 2, 18Z thru September 17, 06Z, and as such, position comparisons are possible only for this timespan.
Since I give only SSHS categories in my tracks, I don't calculate intensity errors in units of speed, but in categories. For this purpose, I define tropical or subtropical storms as "Category 0", tropical or subtropical depressions as "Category -1" and non-existence of a tropical or subtropical cyclone as "Category -2".
In the 33 tracks, formation times ranged between September 3, 06Z and September 7, 12Z. Average was September 4, 22Z and median was September 4, 12Z.
In the 35 cases (33 tracks and 2 complete misses), peak intensity ranged between Category -2 and Category 5. Average was Category 2.31 and median was Category 2.
In the 33 tracks, dissipation times ranged between September 5, 00Z and October 15, 06Z. Average was September 19, 13Z and median was September 19, 00Z.
At the lead time of 1 day (24 hours), there were 1 hits, 4 false detections and 0 misses. 5 available position comparisons produce an average error of 118 nautical miles.
At the lead time of 2 days (48 hours), there were 2 hits, 4 false detections and 0 misses. 6 available position comparisons produce an average error of 152 nautical miles.
At the lead time of 3 days (72 hours), there were 3 hits, 4 false detections and 0 misses. 7 available position comparisons produce an average error of 203 nautical miles.
At the lead time of 4 days (96 hours), there were 2 hits, 4 false detections and 2 misses. 8 available position comparisons produce an average error of 211 nautical miles.
At the lead time of 5 days (120 hours), there were 3 hits, 3 false detections and 2 misses. 8 available position comparisons produce an average error of 237 nautical miles.
At the lead time of 6 days (144 hours), there were 3 hits, 3 false detections and 3 misses. 9 available position comparisons produce an average error of 252 nautical miles.
At the lead time of 7 days (168 hours), there were 4 hits, 5 false detections and 4 misses. 11 available position comparisons produce an average error of 249 nautical miles.
At the lead time of 8 days (192 hours), there were 6 hits, 8 false detections and 2 misses. 14 available position comparisons produce an average error of 230 nautical miles.
At the lead time of 9 days (216 hours), there were 6 hits, 9 false detections and 3 misses. 15 available position comparisons produce an average error of 236 nautical miles.
At the lead time of 10 days (240 hours), there were 7 hits, 8 false detections and 3 misses. 14 available position comparisons produce an average error of 182 nautical miles.
At the lead time of 11 days (264 hours), there were 8 hits, 9 false detections and 3 misses. 16 available position comparisons produce an average error of 238 nautical miles.
At the lead time of 12 days (288 hours), there were 10 hits, 7 false detections and 3 misses. 15 available position comparisons produce an average error of 245 nautical miles.
At the lead time of 13 days (312 hours), there were 10 hits, 6 false detections and 3 misses. 13 available position comparisons produce an average error of 318 nautical miles.
At the lead time of 14 days (336 hours), there were 11 hits, 8 false detections and 4 misses. 15 available position comparisons produce an average error of 326 nautical miles.
At the lead time of 15 days (360 hours), there were 11 hits, 12 false detections and 5 misses. 18 available position comparisons produce an average error of 316 nautical miles.
At the lead time of 16 days (384 hours), there were 14 hits, 13 false detections and 4 misses. 23 available position comparisons produce an average error of 427 nautical miles.
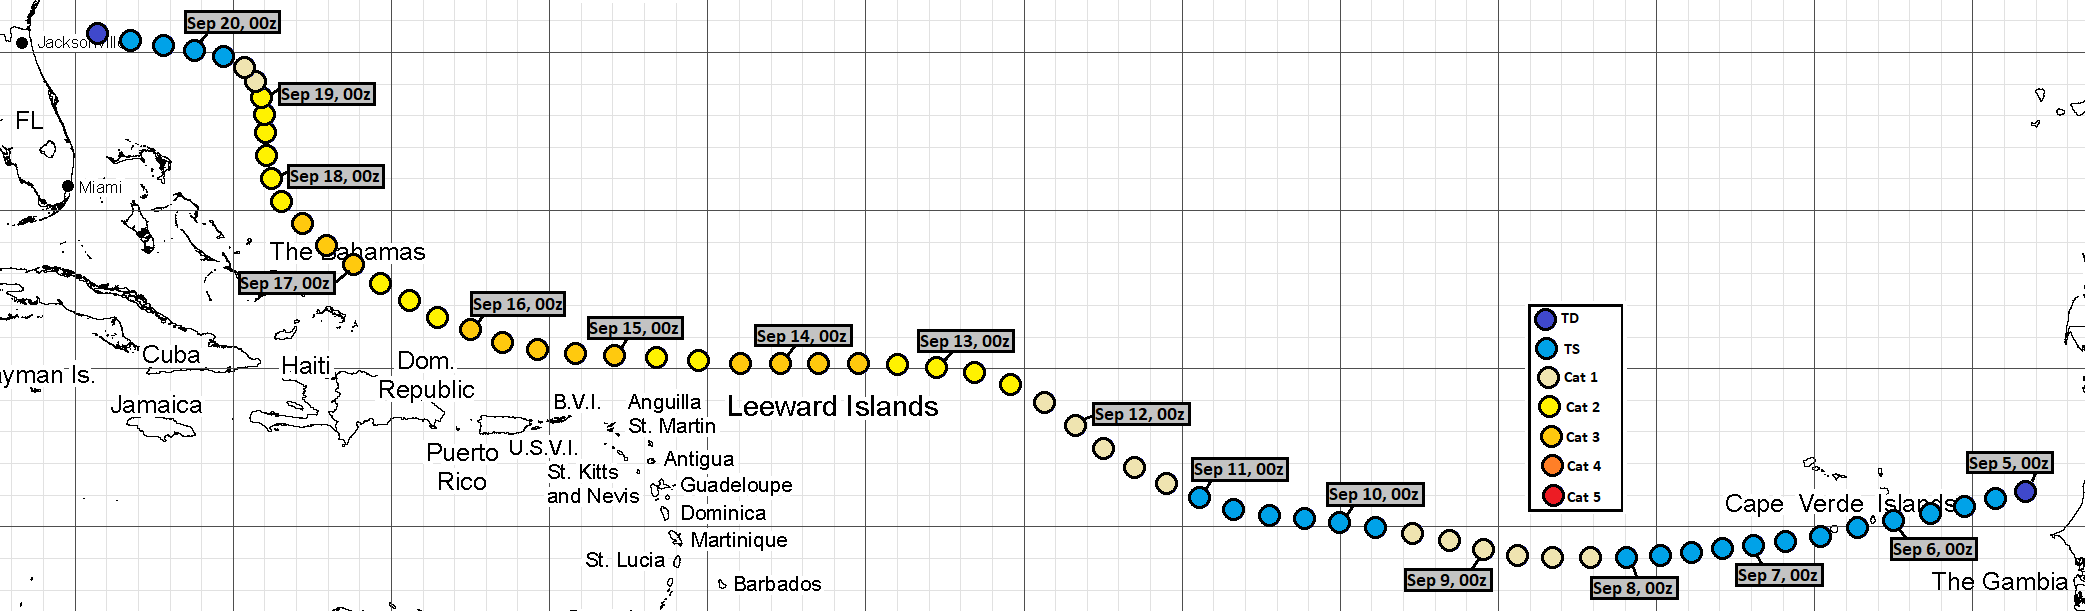
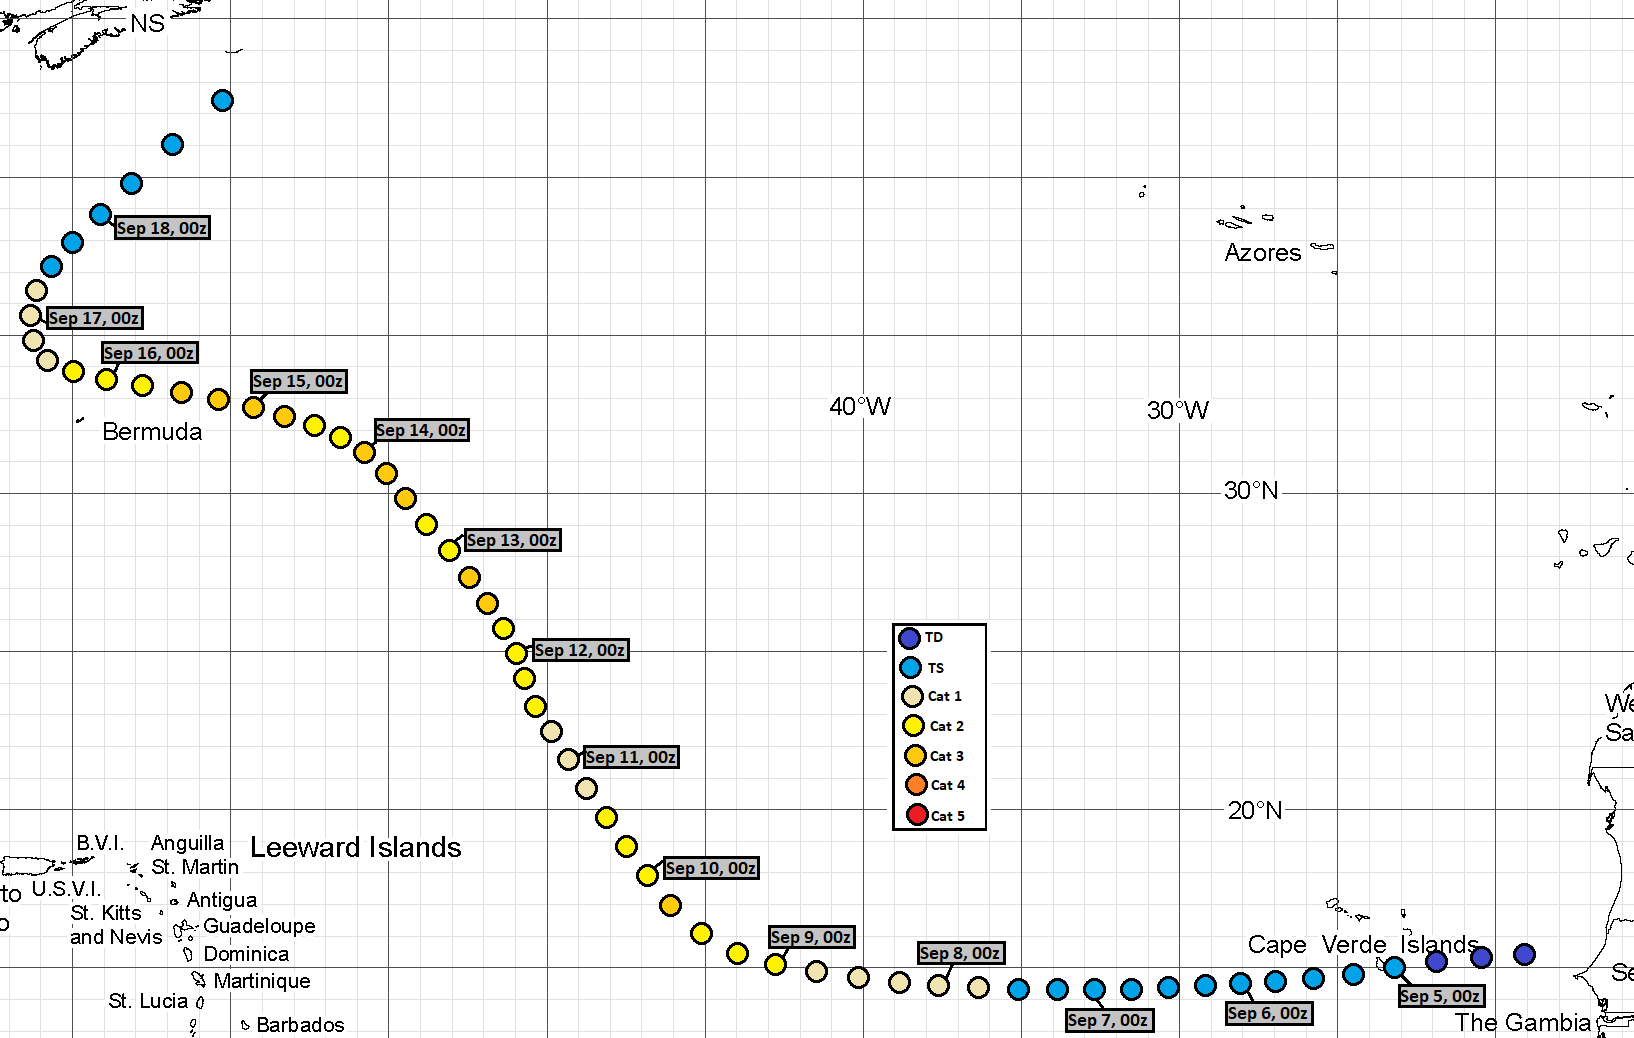
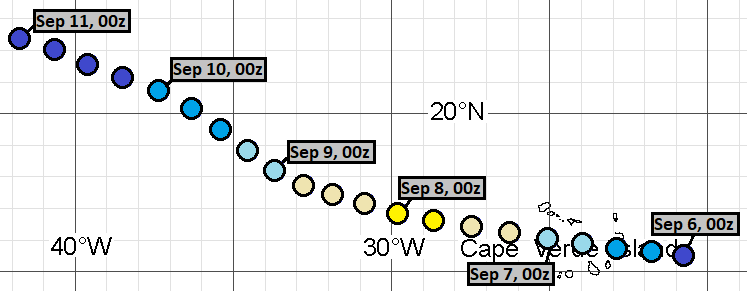
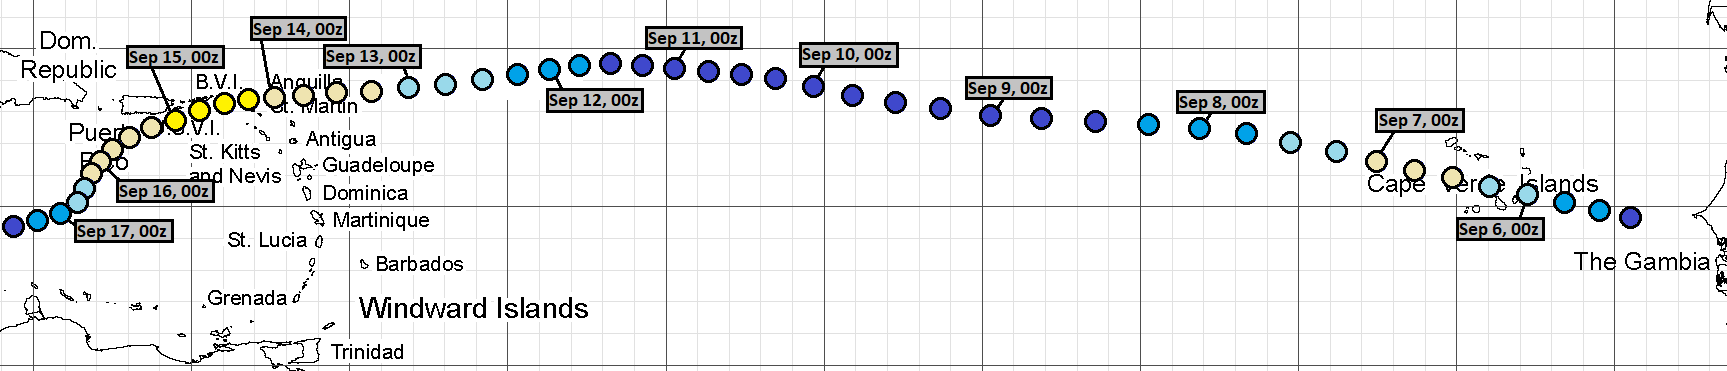
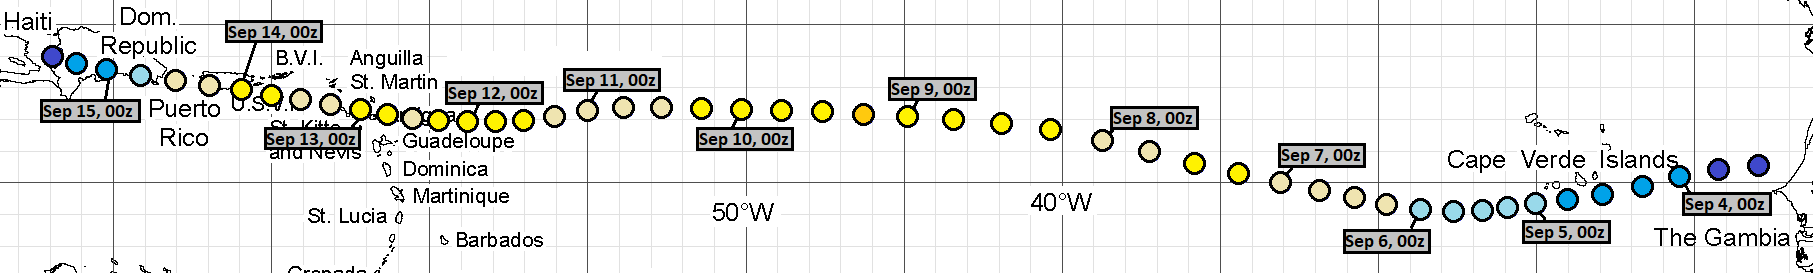
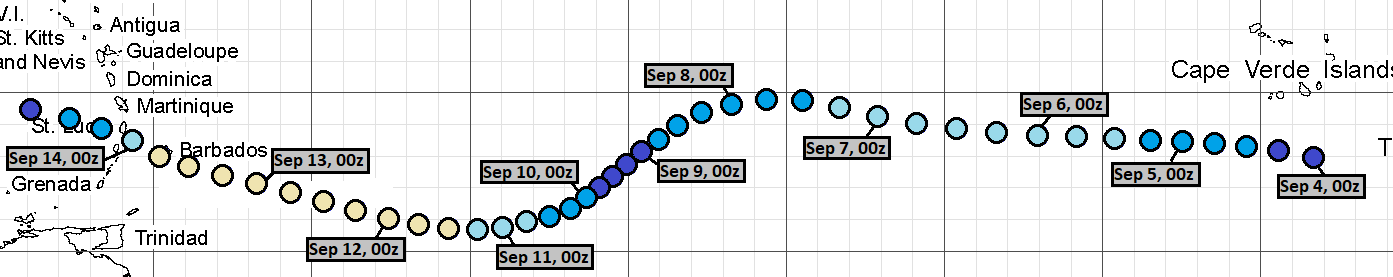
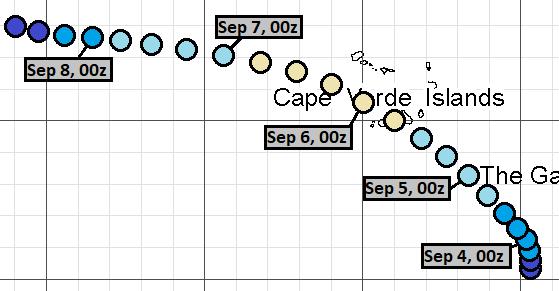
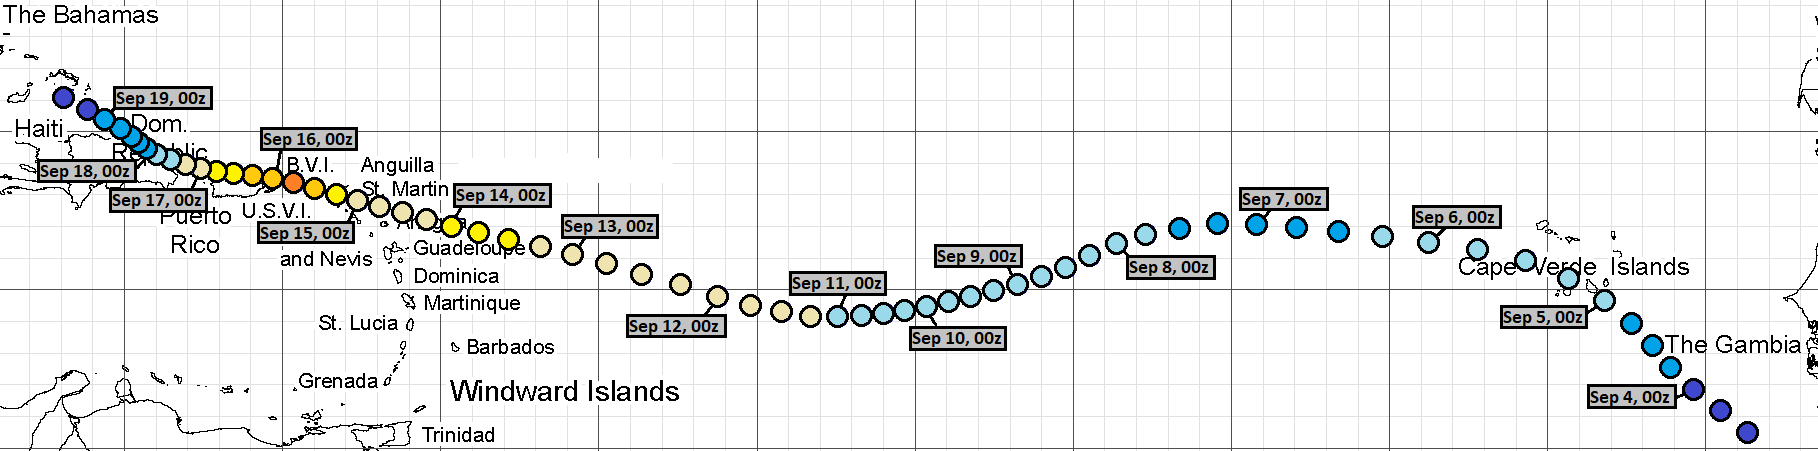
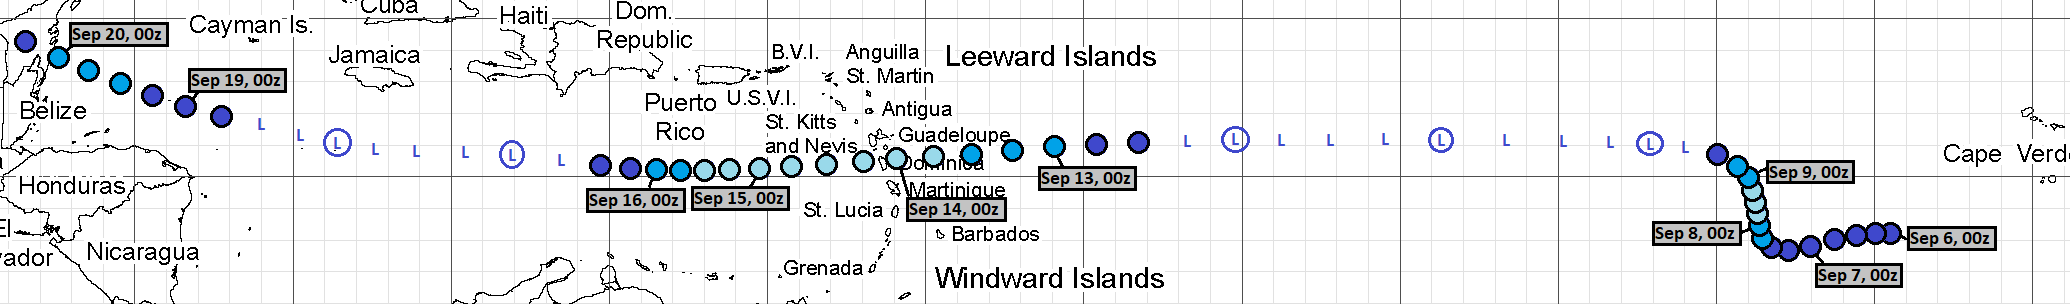
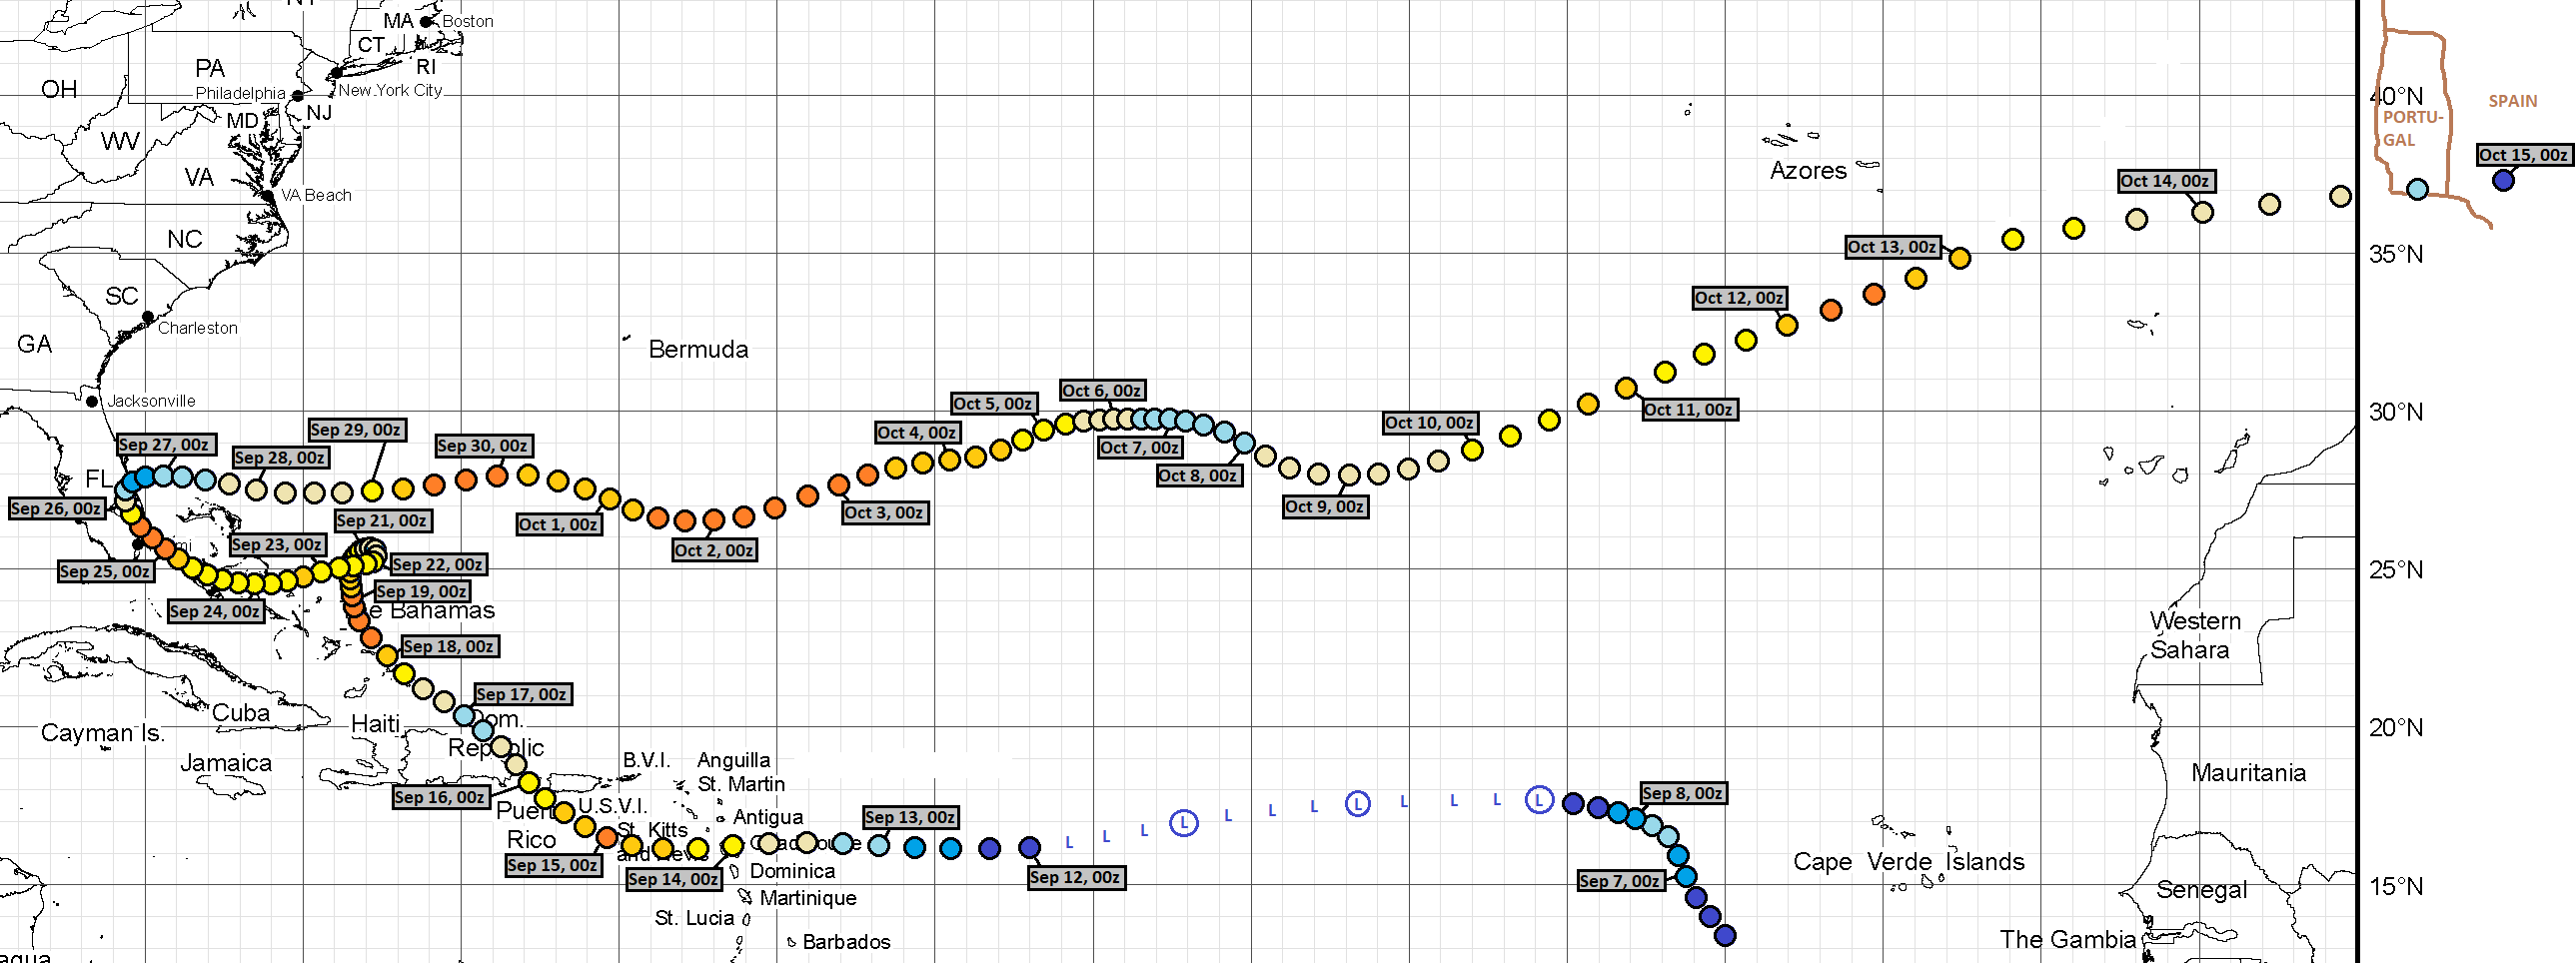
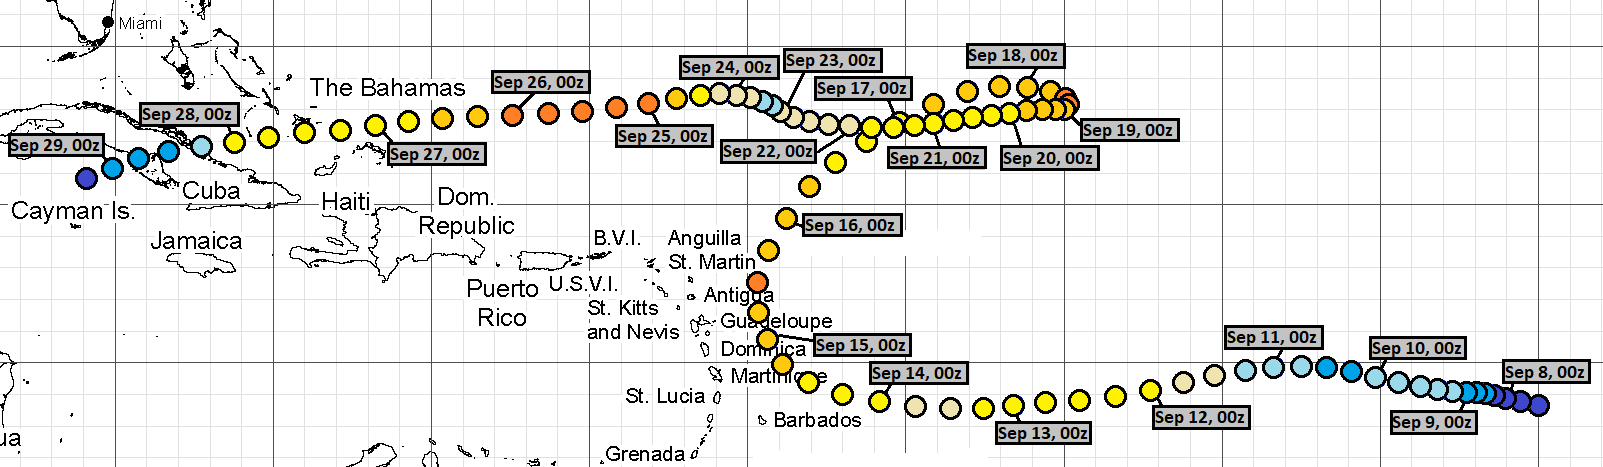
Here are the tracks once again.
August 19, 18Z run:
 August 20, 06Z run:
 August 20, 12Z run:
August 20, 18Z run:
 August 21, 06Z run:
 August 21, 12Z run:
August 21, 18Z run:
 August 22, 06Z run:
 August 22, 12Z run:
 August 22, 18Z run:
 August 23, 06Z run:
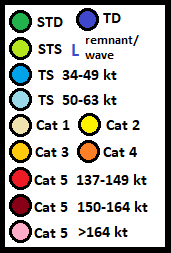
 Beginning with August 23, 12Z, run, coloration scheme changed to the
following, and this legend ceased to be included in every track.
Beginning with August 23, 12Z, run, coloration scheme changed to the
following, and this legend ceased to be included in every track.
August 23, 12Z run:
 August 23, 18Z run:
 August 24, 18Z run:
 August 25, 06Z run:
August 26, 12Z run:
 August 26, 18Z run:
 August 27, 06Z run:

August 27, 12Z run:
 August 27, 18Z run:

August 28, 06Z run:
August 28, 18Z run:
 August 29, 12Z run:
 August 29, 18Z run:
 August 30, 12Z run:

August 31, 18Z run:

September 1, 12Z run:
 September 2, 12Z run:
 September 3, 12Z run:
 September 4, 12Z run:
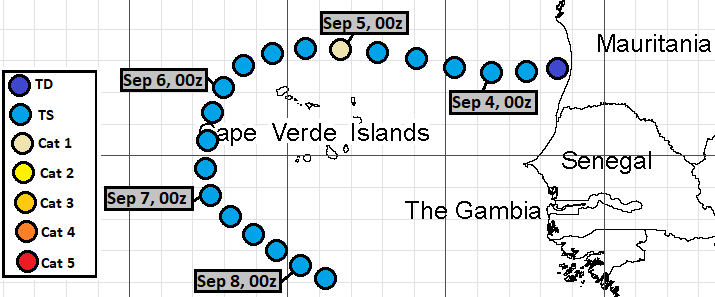
September 5, 06Z run:

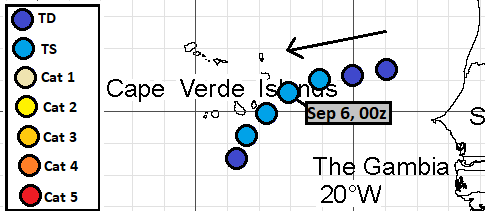
September 6, 06Z run:
 September 7, 12Z run:
The complete misses were from following GEFS runs:
August 24, 06Z
August 25, 12Z
As of this analysis, best track positions are available September 2, 18Z thru September 17, 06Z, and as such, position comparisons are possible only for this timespan.
Since I give only SSHS categories in my tracks, I don't calculate intensity errors in units of speed, but in categories. For this purpose, I define tropical or subtropical storms as "Category 0", tropical or subtropical depressions as "Category -1" and non-existence of a tropical or subtropical cyclone as "Category -2".
In the 33 tracks, formation times ranged between September 3, 06Z and September 7, 12Z. Average was September 4, 22Z and median was September 4, 12Z.
In the 35 cases (33 tracks and 2 complete misses), peak intensity ranged between Category -2 and Category 5. Average was Category 2.31 and median was Category 2.
In the 33 tracks, dissipation times ranged between September 5, 00Z and October 15, 06Z. Average was September 19, 13Z and median was September 19, 00Z.
At the lead time of 1 day (24 hours), there were 1 hits, 4 false detections and 0 misses. 5 available position comparisons produce an average error of 118 nautical miles.
At the lead time of 2 days (48 hours), there were 2 hits, 4 false detections and 0 misses. 6 available position comparisons produce an average error of 152 nautical miles.
At the lead time of 3 days (72 hours), there were 3 hits, 4 false detections and 0 misses. 7 available position comparisons produce an average error of 203 nautical miles.
At the lead time of 4 days (96 hours), there were 2 hits, 4 false detections and 2 misses. 8 available position comparisons produce an average error of 211 nautical miles.
At the lead time of 5 days (120 hours), there were 3 hits, 3 false detections and 2 misses. 8 available position comparisons produce an average error of 237 nautical miles.
At the lead time of 6 days (144 hours), there were 3 hits, 3 false detections and 3 misses. 9 available position comparisons produce an average error of 252 nautical miles.
At the lead time of 7 days (168 hours), there were 4 hits, 5 false detections and 4 misses. 11 available position comparisons produce an average error of 249 nautical miles.
At the lead time of 8 days (192 hours), there were 6 hits, 8 false detections and 2 misses. 14 available position comparisons produce an average error of 230 nautical miles.
At the lead time of 9 days (216 hours), there were 6 hits, 9 false detections and 3 misses. 15 available position comparisons produce an average error of 236 nautical miles.
At the lead time of 10 days (240 hours), there were 7 hits, 8 false detections and 3 misses. 14 available position comparisons produce an average error of 182 nautical miles.
At the lead time of 11 days (264 hours), there were 8 hits, 9 false detections and 3 misses. 16 available position comparisons produce an average error of 238 nautical miles.
At the lead time of 12 days (288 hours), there were 10 hits, 7 false detections and 3 misses. 15 available position comparisons produce an average error of 245 nautical miles.
At the lead time of 13 days (312 hours), there were 10 hits, 6 false detections and 3 misses. 13 available position comparisons produce an average error of 318 nautical miles.
At the lead time of 14 days (336 hours), there were 11 hits, 8 false detections and 4 misses. 15 available position comparisons produce an average error of 326 nautical miles.
At the lead time of 15 days (360 hours), there were 11 hits, 12 false detections and 5 misses. 18 available position comparisons produce an average error of 316 nautical miles.
At the lead time of 16 days (384 hours), there were 14 hits, 13 false detections and 4 misses. 23 available position comparisons produce an average error of 427 nautical miles.
Here are the tracks once again.
August 19, 18Z run:
August 20, 18Z run:
August 21, 18Z run:
August 23, 12Z run:
August 26, 12Z run:
August 27, 12Z run:
August 28, 06Z run:
August 28, 18Z run:
August 31, 18Z run:
September 1, 12Z run:
September 5, 06Z run:
September 6, 06Z run:
The complete misses were from following GEFS runs:
August 24, 06Z
August 25, 12Z


Comments
Post a Comment