Verification of tracks made of Chris using GEFS mean fields
I made 13 tracks of Hurricane Chris. Additionally, within 384 hours of cyclogenesis, there were 36 instances, where I missed cyclogenesis entirely. Originally, timing of cyclogenesis was way too early. Later, it happened often, that the tracks didn't show movement to anywhere near U.S. East Coast.
As of this analysis, best track positions are available July 4, 12Z thru July 12, 12Z, and as such, position comparisons are possible only for this timespan.
Since I give only SSHS categories in my tracks, I don't calculate intensity errors in units of speed, but in categories. For this purpose, I define tropical or subtropical storms as "Category 0", tropical or subtropical depressions as "Category -1" and non-existence of a tropical or subtropical cyclone as "Category -2".
In the 13 tracks, formation times ranged between June 27, 18Z and July 5, 18Z. Average was June 30, 21Z and median was July 1, 00Z.
In the 49 cases (13 tracks and 36 complete misses), peak intensity ranged between Category -2 and Category 2. Average was Category -1.22 and median was Category -2.
In the 13 tracks, dissipation times ranged between June 30, 12Z and July 27, 18Z. Average was July 9, 17Z and median was July 8, 00Z.
At the lead time of 1 day (24 hours), there were 1 hits, 0 false detections and 0 misses. 1 available position comparison produces an average error of 41 nautical miles.
At the lead time of 2 days (48 hours), there were 1 hits, 0 false detections and 4 misses. 1 available position comparison produces an average error of 167 nautical miles.
At the lead time of 3 days (72 hours), there were 1 hits, 1 false detections and 9 misses. 1 available position comparison produces an average error of 268 nautical miles.
At the lead time of 4 days (96 hours), there were 0 hits, 2 false detections and 13 misses. No available position comparisons.
At the lead time of 5 days (120 hours), there were 0 hits, 5 false detections and 16 misses. 1 available position comparison produces an average error of 231 nautical miles.
At the lead time of 6 days (144 hours), there were 0 hits, 5 false detections and 18 misses. 2 available position comparisons produce an average error of 199 nautical miles.
At the lead time of 7 days (168 hours), there were 0 hits, 5 false detections and 17 misses. 3 available position comparisons produce an average error of 269 nautical miles.
At the lead time of 8 days (192 hours), there were 2 hits, 3 false detections and 14 misses. 4 available position comparisons produce an average error of 494 nautical miles.
At the lead time of 9 days (216 hours), there were 3 hits, 2 false detections and 12 misses. 5 available position comparisons produce an average error of 633 nautical miles.
At the lead time of 10 days (240 hours), there were 3 hits, 1 false detections and 13 misses. 4 available position comparisons produce an average error of 786 nautical miles.
At the lead time of 11 days (264 hours), there were 4 hits, 1 false detections and 13 misses. 4 available position comparisons produce an average error of 1026 nautical miles.
At the lead time of 12 days (288 hours), there were 3 hits, 2 false detections and 16 misses. 3 available position comparisons produce an average error of 1200 nautical miles.
At the lead time of 13 days (312 hours), there were 3 hits, 3 false detections and 17 misses. 3 available position comparisons produce an average error of 1014 nautical miles.
At the lead time of 14 days (336 hours), there were 1 hits, 6 false detections and 15 misses. 1 available position comparison produces an average error of 690 nautical miles.
At the lead time of 15 days (360 hours), there were 0 hits, 9 false detections and 14 misses. No available position comparisons.
At the lead time of 16 days (384 hours), there were 0 hits, 8 false detections and 12 misses. 1 available position comparison produces an average error of 976 nautical miles.
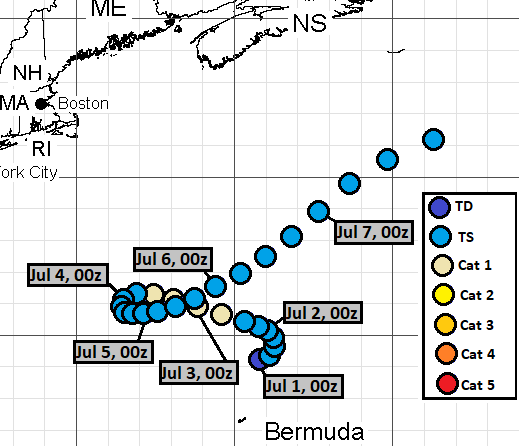
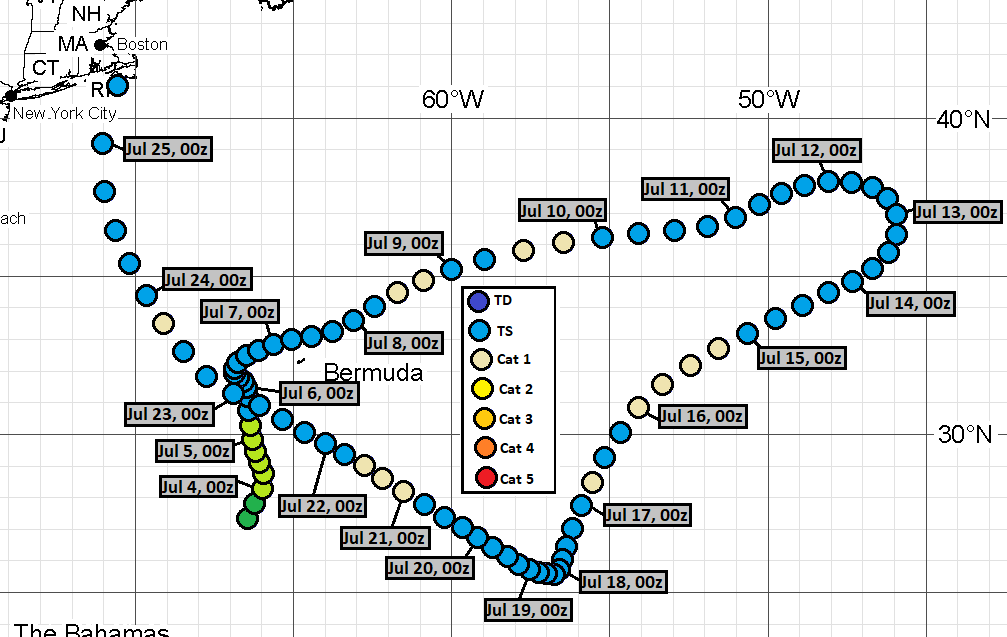
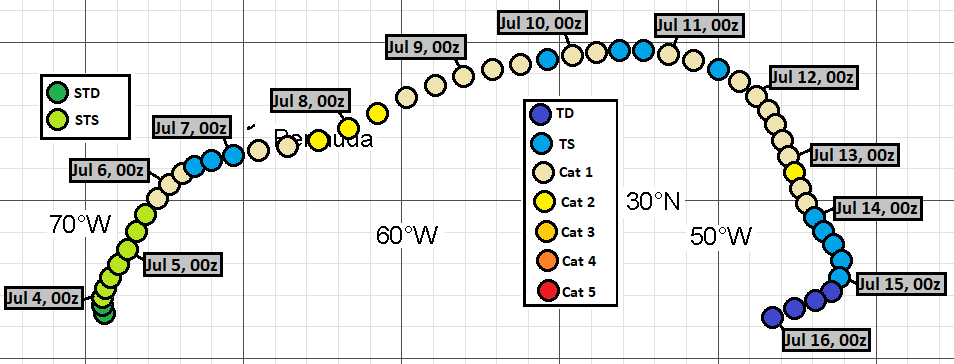
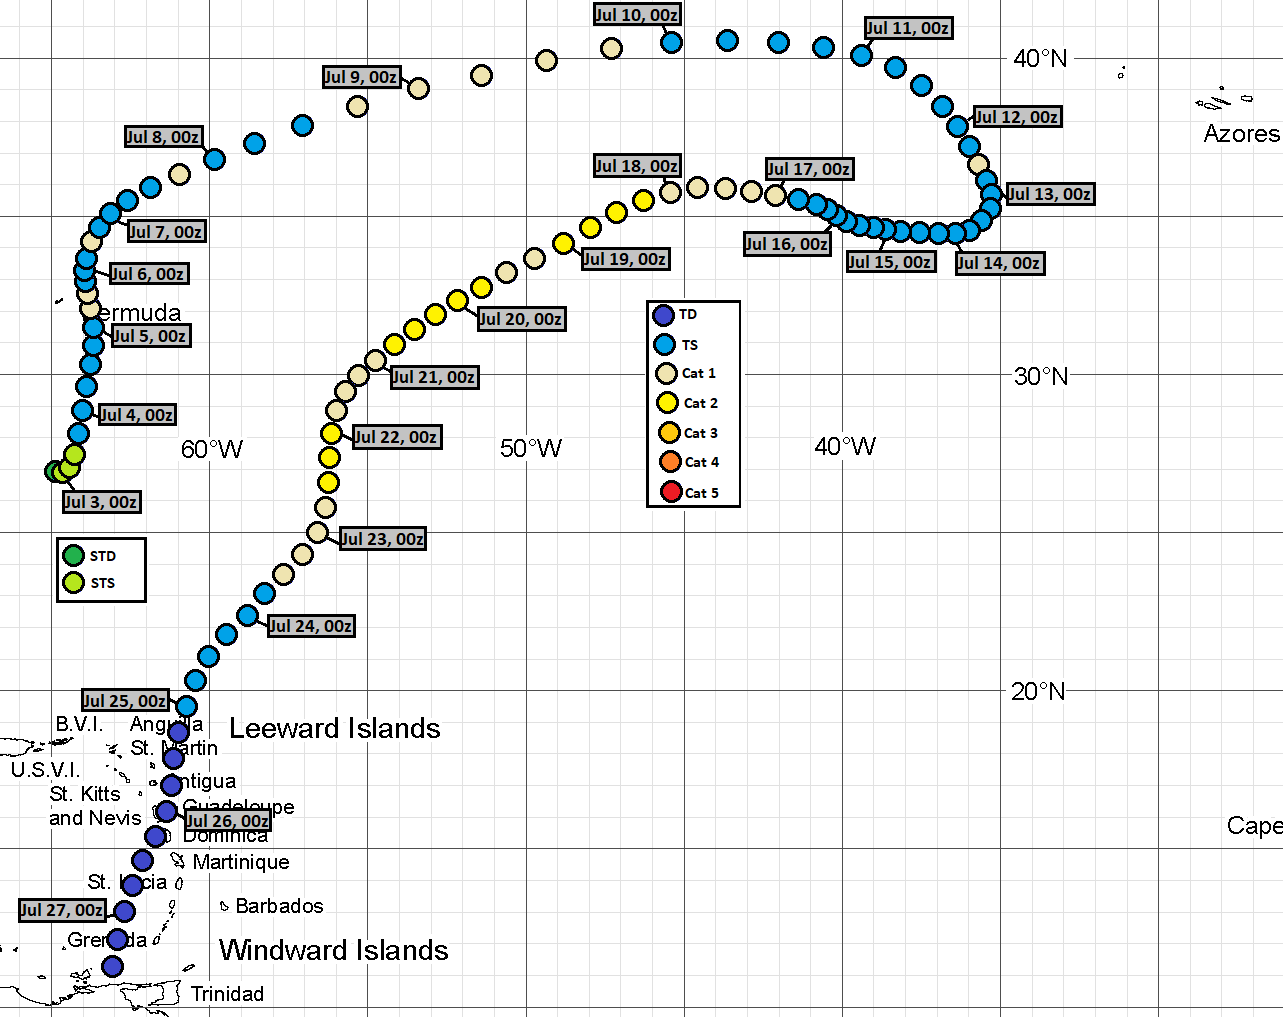
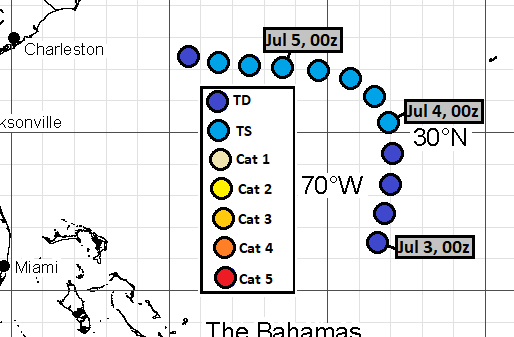
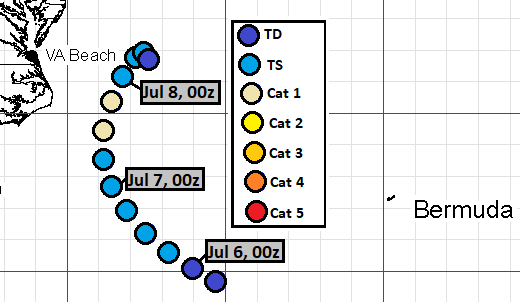
Here are the tracks once again.
June 13, 12Z run:
June 13, 18Z run:
June 14, 12Z run:

June 15, 06Z run:

June 17, 18Z run:
June 18, 12Z run:
June 26, 06Z run:
June 26, 12Z run:

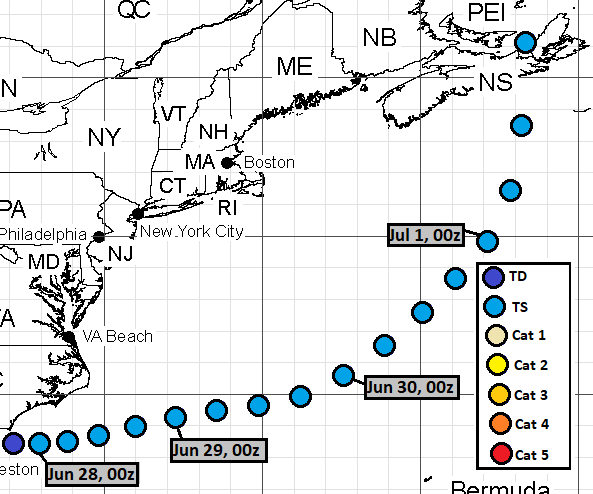
June 28, 06Z run:
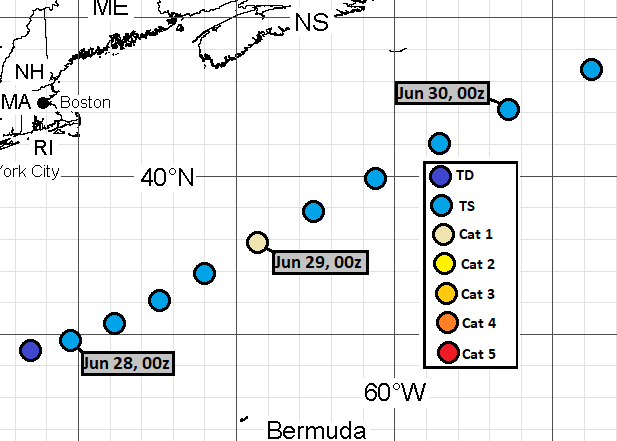
June 29, 00Z run:
June 29, 06Z run:
June 30, 00Z run:
July 5, 18Z run:
The complete misses were from following GEFS runs:
June 21, 06Z
June 21, 12Z
June 21, 18Z
June 22, 06Z
June 24, 06Z
June 24, 12Z
June 24, 18Z
June 25, 06Z
June 25, 12Z
June 25, 18Z
June 26, 00Z
June 26, 18Z
June 27, 00Z
June 27, 06Z
June 27, 12Z
June 27, 18Z
June 28, 00Z
June 28, 12Z
June 28, 18Z
July 1, 06Z
July 1, 12Z
July 1, 18Z
July 2, 06Z
July 2, 12Z
July 2, 18Z
July 3, 00Z
July 3, 06Z
July 3, 12Z
July 3, 18Z
July 4, 00Z
July 4, 06Z
July 4, 12Z
July 4, 18Z
July 5, 00Z
July 5, 06Z
July 5, 12Z
As of this analysis, best track positions are available July 4, 12Z thru July 12, 12Z, and as such, position comparisons are possible only for this timespan.
Since I give only SSHS categories in my tracks, I don't calculate intensity errors in units of speed, but in categories. For this purpose, I define tropical or subtropical storms as "Category 0", tropical or subtropical depressions as "Category -1" and non-existence of a tropical or subtropical cyclone as "Category -2".
In the 13 tracks, formation times ranged between June 27, 18Z and July 5, 18Z. Average was June 30, 21Z and median was July 1, 00Z.
In the 49 cases (13 tracks and 36 complete misses), peak intensity ranged between Category -2 and Category 2. Average was Category -1.22 and median was Category -2.
In the 13 tracks, dissipation times ranged between June 30, 12Z and July 27, 18Z. Average was July 9, 17Z and median was July 8, 00Z.
At the lead time of 1 day (24 hours), there were 1 hits, 0 false detections and 0 misses. 1 available position comparison produces an average error of 41 nautical miles.
At the lead time of 2 days (48 hours), there were 1 hits, 0 false detections and 4 misses. 1 available position comparison produces an average error of 167 nautical miles.
At the lead time of 3 days (72 hours), there were 1 hits, 1 false detections and 9 misses. 1 available position comparison produces an average error of 268 nautical miles.
At the lead time of 4 days (96 hours), there were 0 hits, 2 false detections and 13 misses. No available position comparisons.
At the lead time of 5 days (120 hours), there were 0 hits, 5 false detections and 16 misses. 1 available position comparison produces an average error of 231 nautical miles.
At the lead time of 6 days (144 hours), there were 0 hits, 5 false detections and 18 misses. 2 available position comparisons produce an average error of 199 nautical miles.
At the lead time of 7 days (168 hours), there were 0 hits, 5 false detections and 17 misses. 3 available position comparisons produce an average error of 269 nautical miles.
At the lead time of 8 days (192 hours), there were 2 hits, 3 false detections and 14 misses. 4 available position comparisons produce an average error of 494 nautical miles.
At the lead time of 9 days (216 hours), there were 3 hits, 2 false detections and 12 misses. 5 available position comparisons produce an average error of 633 nautical miles.
At the lead time of 10 days (240 hours), there were 3 hits, 1 false detections and 13 misses. 4 available position comparisons produce an average error of 786 nautical miles.
At the lead time of 11 days (264 hours), there were 4 hits, 1 false detections and 13 misses. 4 available position comparisons produce an average error of 1026 nautical miles.
At the lead time of 12 days (288 hours), there were 3 hits, 2 false detections and 16 misses. 3 available position comparisons produce an average error of 1200 nautical miles.
At the lead time of 13 days (312 hours), there were 3 hits, 3 false detections and 17 misses. 3 available position comparisons produce an average error of 1014 nautical miles.
At the lead time of 14 days (336 hours), there were 1 hits, 6 false detections and 15 misses. 1 available position comparison produces an average error of 690 nautical miles.
At the lead time of 15 days (360 hours), there were 0 hits, 9 false detections and 14 misses. No available position comparisons.
At the lead time of 16 days (384 hours), there were 0 hits, 8 false detections and 12 misses. 1 available position comparison produces an average error of 976 nautical miles.
Here are the tracks once again.
June 13, 12Z run:
June 13, 18Z run:
June 14, 12Z run:
June 15, 06Z run:
June 17, 18Z run:
June 18, 12Z run:
June 26, 06Z run:
June 26, 12Z run:
June 28, 06Z run:
June 29, 00Z run:
June 29, 06Z run:
June 30, 00Z run:
July 5, 18Z run:
The complete misses were from following GEFS runs:
June 21, 06Z
June 21, 12Z
June 21, 18Z
June 22, 06Z
June 24, 06Z
June 24, 12Z
June 24, 18Z
June 25, 06Z
June 25, 12Z
June 25, 18Z
June 26, 00Z
June 26, 18Z
June 27, 00Z
June 27, 06Z
June 27, 12Z
June 27, 18Z
June 28, 00Z
June 28, 12Z
June 28, 18Z
July 1, 06Z
July 1, 12Z
July 1, 18Z
July 2, 06Z
July 2, 12Z
July 2, 18Z
July 3, 00Z
July 3, 06Z
July 3, 12Z
July 3, 18Z
July 4, 00Z
July 4, 06Z
July 4, 12Z
July 4, 18Z
July 5, 00Z
July 5, 06Z
July 5, 12Z


Comments
Post a Comment