Verification of tracks made of Cristobal
I made 16 sets of tracks of Tropical Storm Cristobal, before it was assessed as
a tropical cyclone. In one analysis, there were two tracks, based on assumption, that original center would dissipate overland in Mexico and another one would emerge from Yucatan. I made nine more tracks after cyclogenesis.
Additionally, within 480 hours of cyclogenesis, there were 29 instances,
when I missed cyclogenesis entirely. Almost all of the detections were at short lead times.
For position errors, Amanda is considered to be the precursor of Cristobal. However, since Amanda is in the wrong basin, it is not considered a TC, when calculating hits, false detections and misses.
As of this analysis, best track positions are available May 28, 18Z thru June 10, 06Z, and as such, position comparisons are possible only for this timespan.
Since I give only SSHS categories in my tracks, I don't calculate intensity errors in units of speed, but in categories. For this purpose, I define tropical or subtropical storms as "Category 0", tropical or subtropical depressions as "Category -1" and non-existence of a tropical or subtropical cyclone as "Category -2".
In the 16 sets of tracks (made before operationally recognized cyclogenesis), original formation times ranged between May 31, 18Z and June 7, 18Z. Average was June 4, 06Z and median was June 3, 12Z.
In the 47 cases (18 tracks, before the tracks and data agreed, that tropical storm would remain the peak intensity, and 29 complete misses), peak intensity ranged between Category -2 and Category 4. Average was Category -1.02 and median was Category -2.
In the 25 tracks (made before operationally recognized extratropical transition), final dissipation times ranged between June 3, 00Z and June 14, 06Z. Average was June 8, 23Z and median was June 9, 12Z.
At the lead time of 1 day (24 hours), there were 7 hits, 0 false detections and 1 miss. 7 available position comparisons produce an average error of 44 nautical miles.
At the lead time of 2 days (48 hours), there were 6 hits, 0 false detections and 3 misses. 6 available position comparisons produce an average error of 80 nautical miles.
At the lead time of 3 days (72 hours), there were 4 hits, 0 false detections and 5 misses. 4 available position comparisons produce an average error of 103 nautical miles.
At the lead time of 4 days (96 hours), there were 3 hits, 0 false detections and 8 misses. 3 available position comparisons produce an average error of 92 nautical miles.
At the lead time of 5 days (120 hours), there were 1 hit, 0 false detections and 10 misses. 2 available position comparisons produce an average error of 103 nautical miles.
At the lead time of 6 days (144 hours), there were 4 hits, 0 false detections and 7 misses. 4 available position comparisons produce an average error of 152 nautical miles.
At the lead time of 7 days (168 hours), there were 6 hits, 0 false detections and 8 misses. 7 available position comparisons produce an average error of 221 nautical miles.
At the lead time of 8 days (192 hours), there were 9 hits, 0 false detections and 6 misses. 10 available position comparisons produce an average error of 215 nautical miles.
At the lead time of 9 days (216 hours), there were 9 hits, 0 false detections and 7 misses. 9 available position comparisons produce an average error of 239 nautical miles.
At the lead time of 10 days (240 hours), there were 12 hits, 0 false detections and 4 misses. 12 available position comparisons produce an average error of 376 nautical miles.
At the lead time of 11 days (264 hours), there were 9 hits, 0 false detections and 7 misses. 9 available position comparisons produce an average error of 547 nautical miles.
At the lead time of 12 days (288 hours), there were 4 hits, 2 false detections and 13 misses. 4 available position comparisons produce an average error of 795 nautical miles.
At the lead time of 13 days (312 hours), there were 0 hits, 2 false detections and 17 misses. No available position comparisons.
At the lead time of 14 days (336 hours), there were 0 hits, 2 false detections and 17 misses. No available position comparisons.
At the lead time of 15 days (360 hours), there were 0 hits, 1 false detection and 18 misses. No available position comparisons.
At the lead time of 16 days (384 hours), there were 0 hits, 0 false detections and 19 misses. No available position comparisons.
At the lead time of 17 days (408 hours), there were 0 hits, 1 false detection and 19 misses. 1 available position comparison produces an average error of 580 nautical miles.
At the lead time of 18 days (432 hours), there were 1 hit, 0 false detections and 20 misses. 1 available position comparison produces an average error of 602 nautical miles.
At the lead time of 19 days (456 hours), there were 1 hit, 0 false detections and 22 misses. 1 available position comparison produces an average error of 716 nautical miles.
At the lead time of 20 days (480 hours), there were 0 hits, 0 false detections and 23 misses. No available position comparisons.
Circle coloration scheme

Here are the tracks once again.
Here are the tracks once again.
May 14, 18Z:

May 24, 18Z:

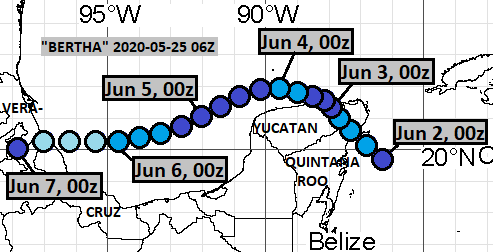
May 25, 06Z:
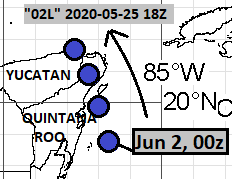
May 25, 18Z:
May 26, 06Z:

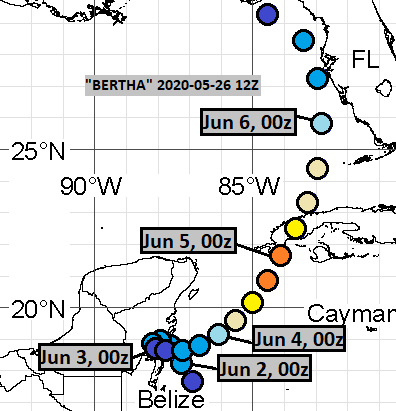
May 26, 12Z:
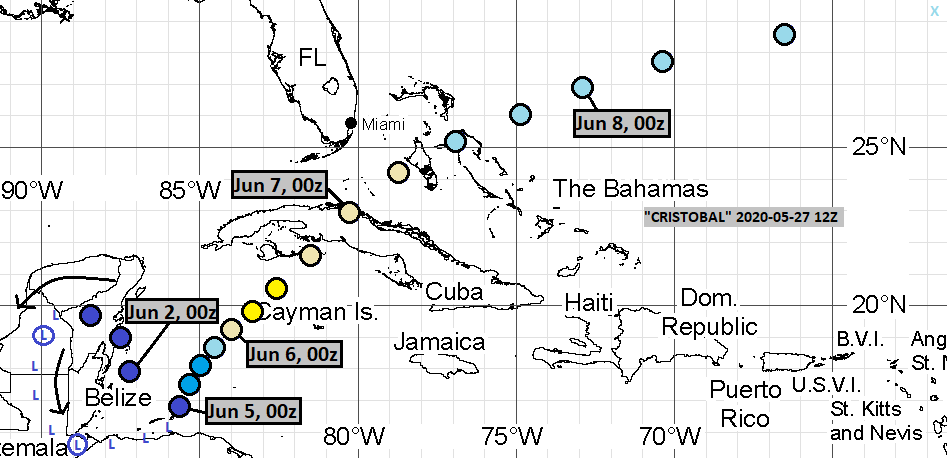
May 27, 12Z:
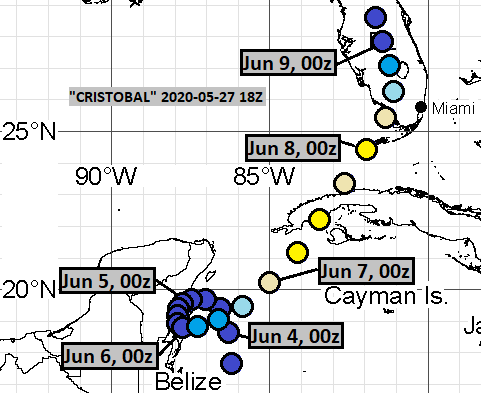
May 27, 18Z:
May 28, 12Z:
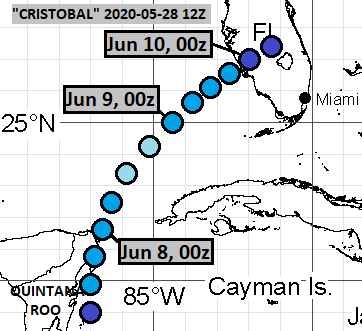
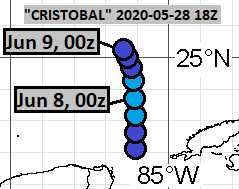
May 28, 18Z:
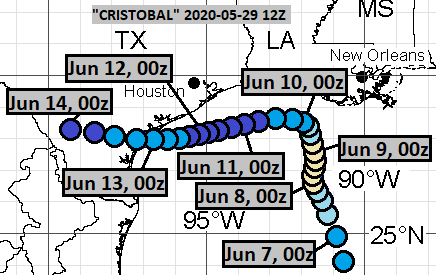
May 29, 12Z:
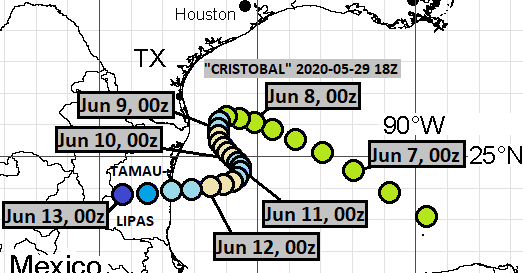
May 29, 18Z:
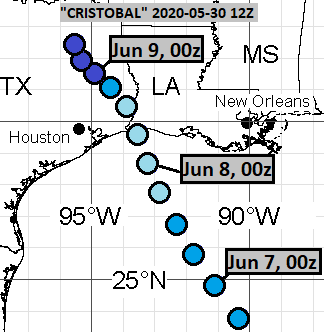
May 30, 12Z:
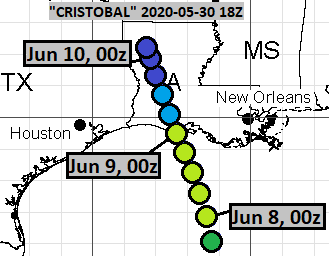
May 30, 18Z:
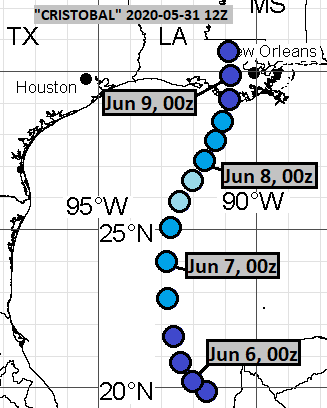
May 31, 12Z:
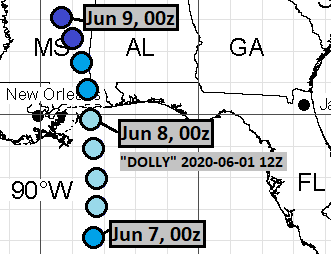
June 1, 12Z (part 1):
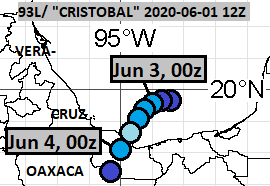
June 1, 12Z (part 2):
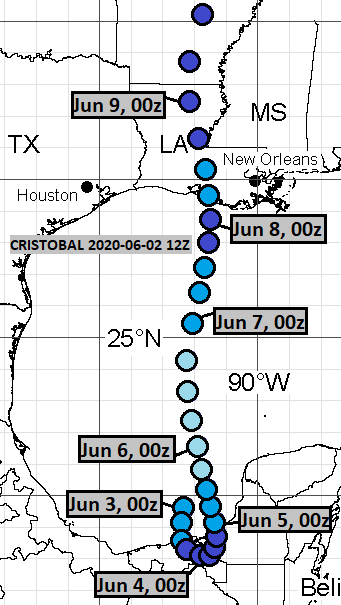
June 2, 12Z:
June 4, 06Z:

June 5, 12Z:

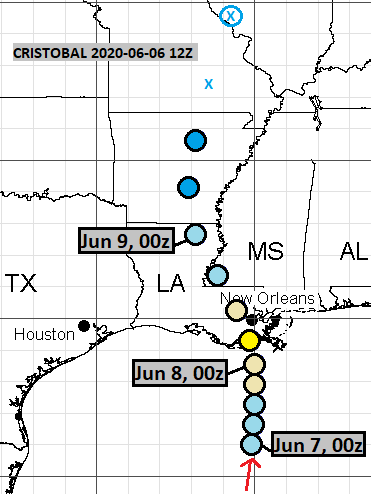
June 6, 12Z:
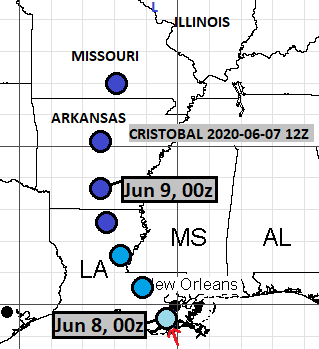
June 7, 12Z:
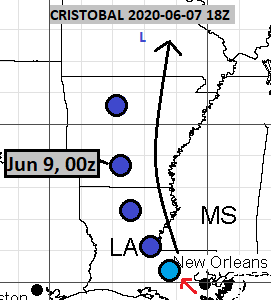
June 7, 18Z:
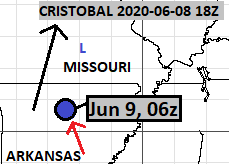
June 8, 18Z:
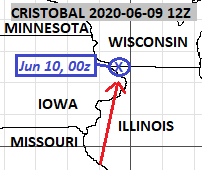
June 9, 12Z:
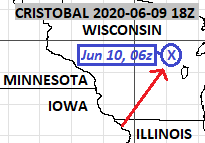
June 9, 18Z:
The complete misses were from the following model cycles:
May 12, 18Z
May 13, 06Z
May 13, 12Z
May 13, 18Z
May 14, 06Z
May 14, 12Z
May 15, 06Z
May 15, 12Z
May 15, 18Z
May 16, 06Z
May 16, 12Z
May 16, 18Z
May 17, 06Z
May 17, 12Z
May 17, 18Z
May 18, 06Z
May 18, 12Z
May 18, 18Z
May 19, 06Z
May 20, 06Z
May 20, 12Z
May 20, 18Z
May 21, 06Z
May 21, 12Z
May 21, 18Z
May 22, 06Z
May 23, 06Z
May 24, 06Z
May 24, 12Z

Comments
Post a Comment