Verification of tracks made of Cristina
I made 19 tracks of Tropical Storm Cristina, before it was assessed as
a tropical cyclone. I made five more tracks after that point.
Additionally, within 480 hours of cyclogenesis, there were four instances,
when I missed cyclogenesis entirely. Detection rate was good, but originally the expected time of cyclogenesis (or the time of entering East Pacific) was weeks too early. Some of the early tracks began in North Atlantic; only the part in East Pacific will be counted as Cristina.
As of this analysis, best track positions are available July 5, 18Z thru July 13, 00Z, and as such, position comparisons are possible only for this timespan.
Since I give only SSHS categories in my tracks, I don't calculate intensity errors in units of speed, but in categories. For this purpose, I define tropical or subtropical storms as "Category 0", tropical or subtropical depressions as "Category -1" and non-existence of a tropical or subtropical cyclone as "Category -2".
In the 19 tracks (made before operationally recognized cyclogenesis), formation times ranged between June 18, 06Z and July 8, 00Z. Average was June 30, 15Z and median was June 29, 12Z.
In the 24 cases (20 tracks, before the tracks and data agreed, that tropical storm would remain the peak intensity, and 4 complete misses), peak intensity ranged between Category -2 and Category 5. Average was Category 1.92 and median was Category 3.
In the 24 tracks (made before operationally recognized degeneration into remnant low), dissipation times ranged between June 24, 06Z and July 14, 18Z. Average was July 8, 06Z and median was July 7, 03Z.
At the lead time of 1 day (24 hours), there were 4 hits, 0 false detections and 0 misses. 4 available position comparisons produce an average error of 35 nautical miles.
At the lead time of 2 days (48 hours), there were 2 hits, 0 false detections and 1 miss. 2 available position comparisons produce an average error of 38 nautical miles.
At the lead time of 3 days (72 hours), there were 2 hits, 0 false detections and 0 misses. 2 available position comparisons produce an average error of 33 nautical miles.
At the lead time of 4 days (96 hours), there were 2 hits, 0 false detections and 0 misses. 2 available position comparisons produce an average error of 69 nautical miles.
At the lead time of 5 days (120 hours), there were 0 hits, 0 false detections and 1 miss. 1 available position comparison produces an average error of 58 nautical miles.
At the lead time of 6 days (144 hours), there were 0 hits, 0 false detections and 0 misses. No available position comparisons.
At the lead time of 7 days (168 hours), there were 0 hits, 0 false detections and 0 misses. No available position comparisons.
At the lead time of 8 days (192 hours), there were 0 hits, 2 false detections and 2 misses. No available position comparisons.
At the lead time of 9 days (216 hours), there were 1 hit, 4 false detections and 1 miss. 1 available position comparison produces an average error of 271 nautical miles.
At the lead time of 10 days (240 hours), there were 2 hits, 4 false detections and 0 misses. 3 available position comparisons produce an average error of 393 nautical miles.
At the lead time of 11 days (264 hours), there were 3 hits, 3 false detections and 0 misses. 4 available position comparisons produce an average error of 439 nautical miles.
At the lead time of 12 days (288 hours), there were 3 hits, 5 false detections and 1 miss. 3 available position comparisons produce an average error of 454 nautical miles.
At the lead time of 13 days (312 hours), there were 2 hits, 8 false detections and 3 misses. 3 available position comparisons produce an average error of 439 nautical miles.
At the lead time of 14 days (336 hours), there were 2 hits, 10 false detections and 3 misses. 2 available position comparisons produce an average error of 457 nautical miles.
At the lead time of 15 days (360 hours), there were 2 hits, 10 false detections and 4 misses. 3 available position comparisons produce an average error of 608 nautical miles.
At the lead time of 16 days (384 hours), there were 1 hit, 7 false detections and 6 misses. 2 available position comparisons produce an average error of 431 nautical miles.
At the lead time of 17 days (408 hours), there were 2 hits, 7 false detections and 5 misses. 2 available position comparisons produce an average error of 353 nautical miles.
At the lead time of 18 days (432 hours), there were 3 hits, 7 false detections and 5 misses. 4 available position comparisons produce an average error of 512 nautical miles.
At the lead time of 19 days (456 hours), there were 4 hits, 6 false detections and 5 misses. 4 available position comparisons produce an average error of 580 nautical miles.
At the lead time of 20 days (480 hours), there were 2 hits, 4 false detections and 7 misses. 2 available position comparisons produce an average error of 704 nautical miles.
Circle coloration scheme

Here are the tracks once again.
May 28, 12Z:
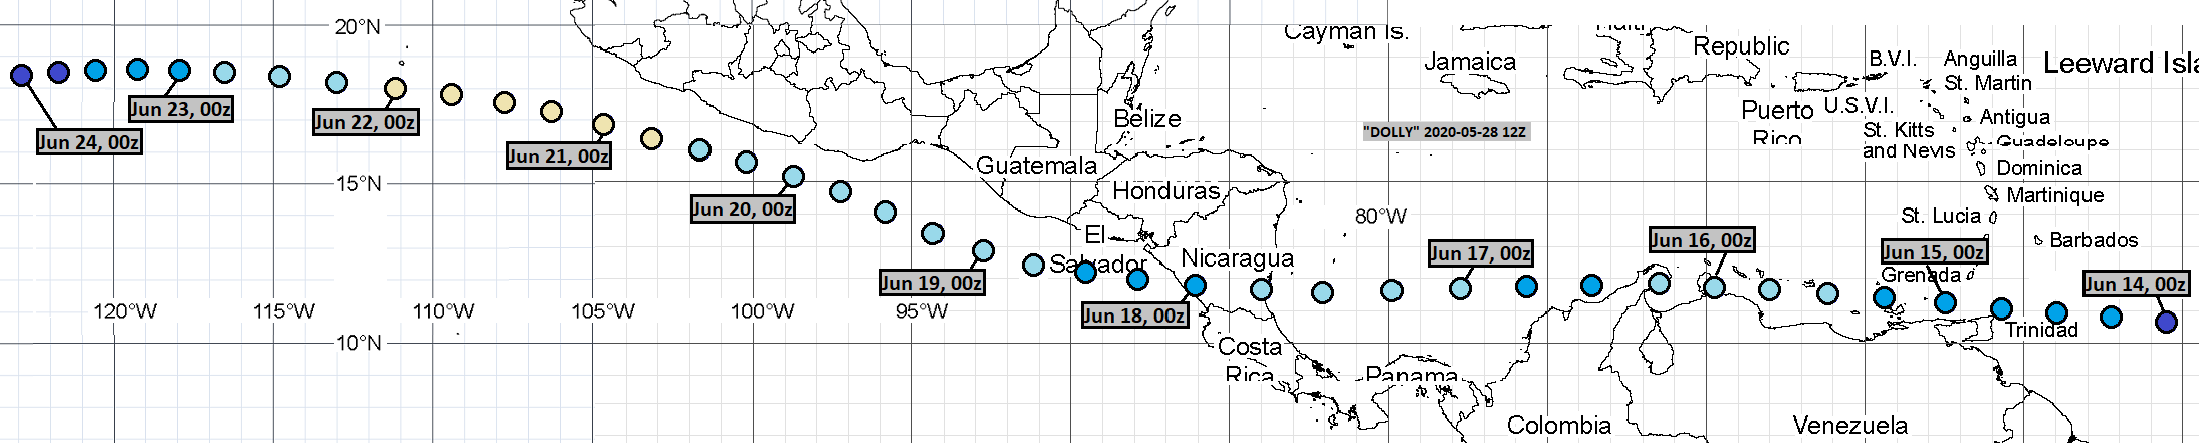
June 9, 12Z:
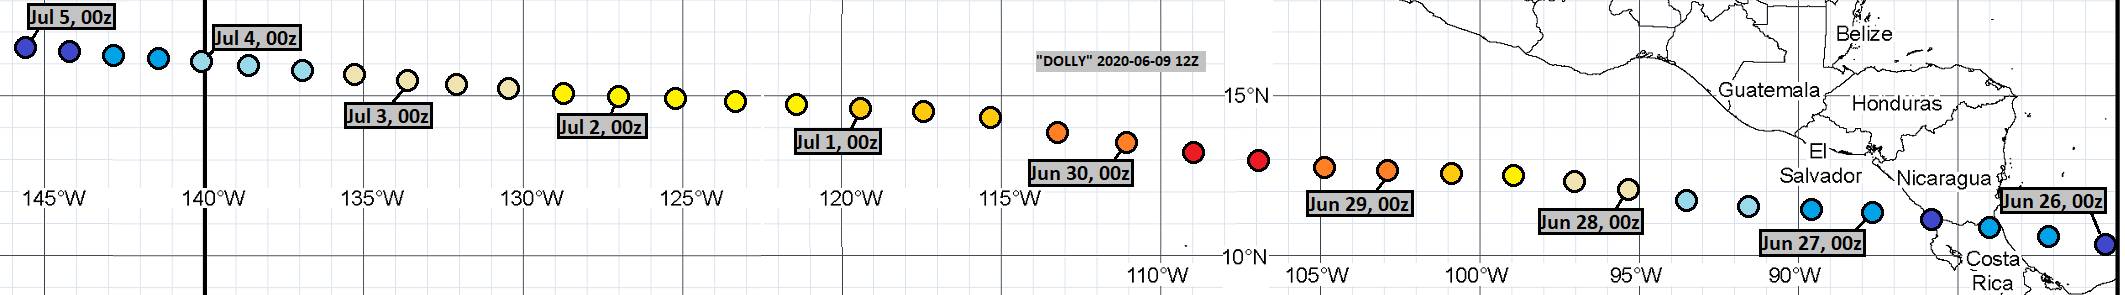
June 10, 12Z:

June 13, 12Z:

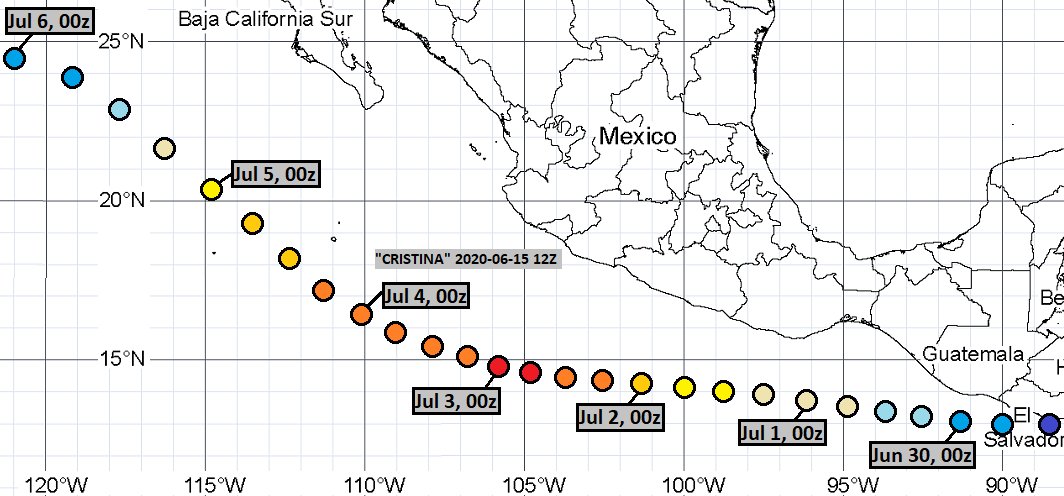
June 15, 00Z:

June 15, 12Z:
June 15, 18Z:

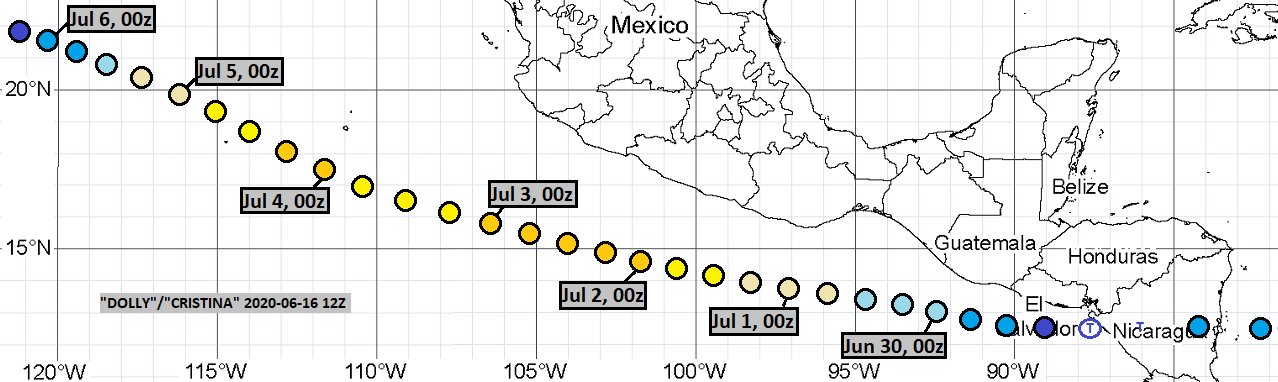
June 16, 12Z:
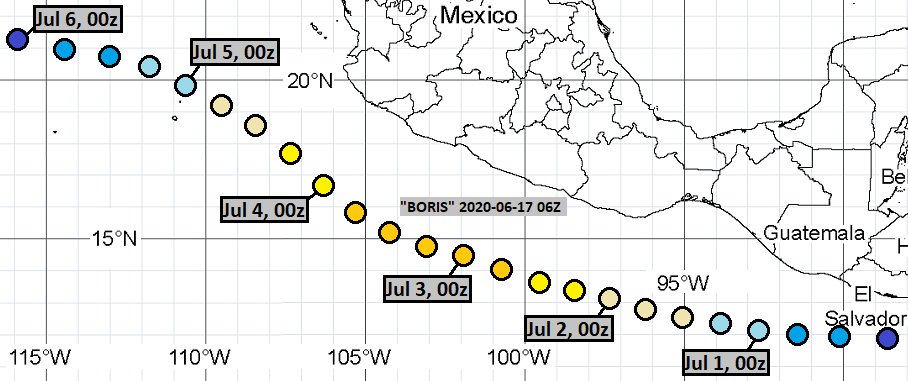
June 17, 06Z:
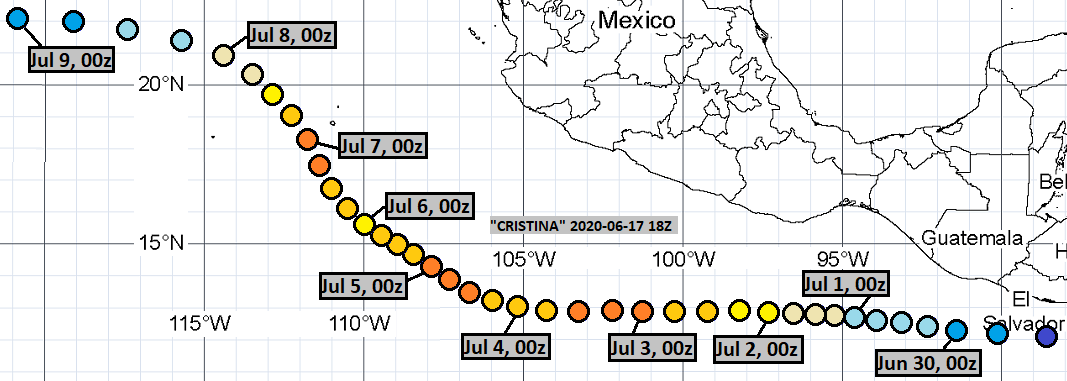
June 17, 18Z:
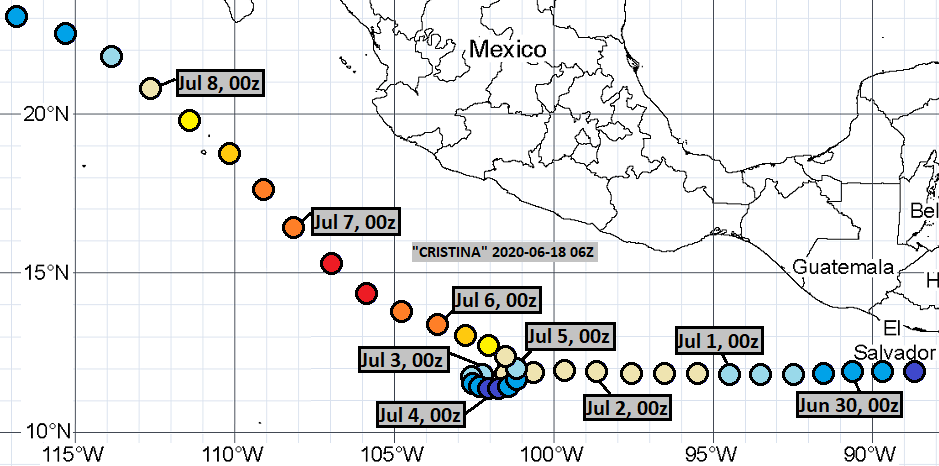
June 18, 06Z:
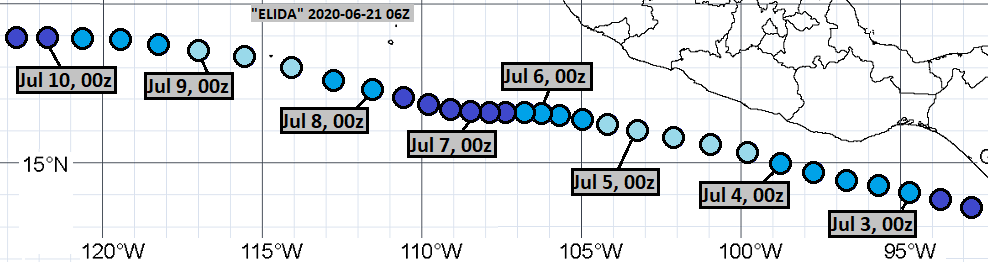
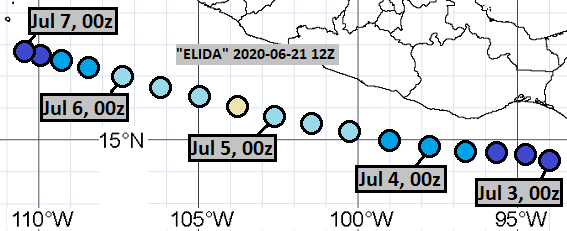
June 21, 06Z:
June 21, 12Z:
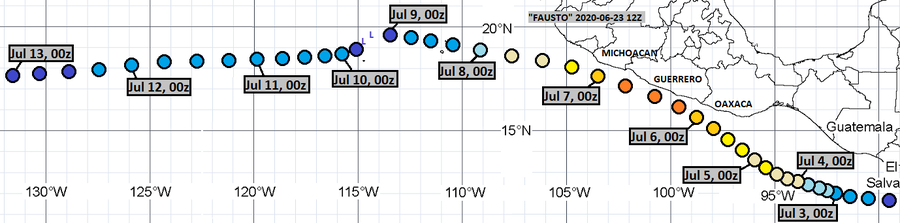
June 23, 12Z:
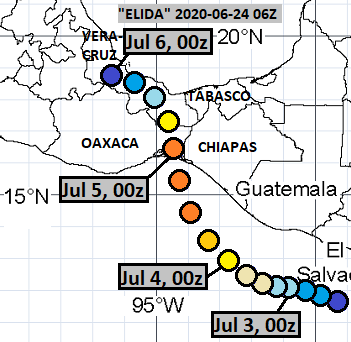
June 24, 06Z:
June 25, 06Z:

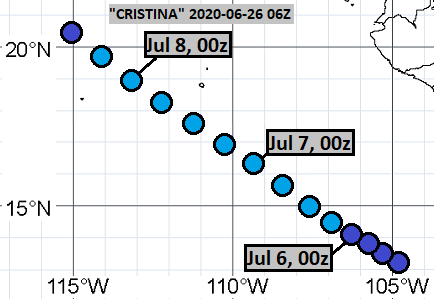
June 26, 06Z:
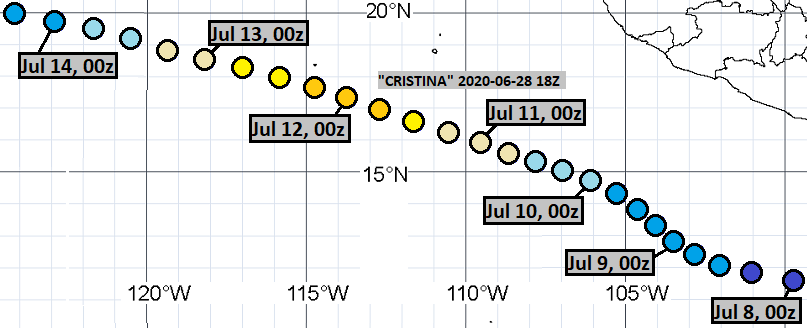
June 28, 18Z:
June 29, 12Z:

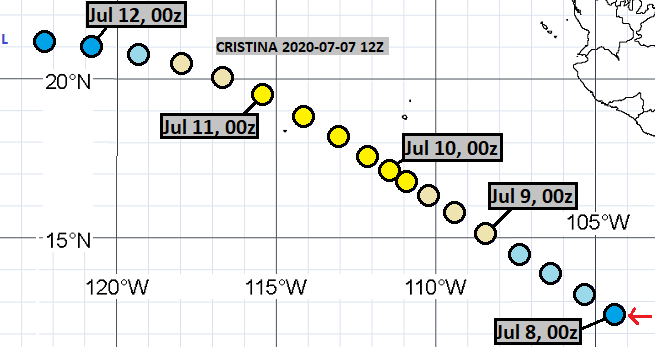
July 7, 12Z:
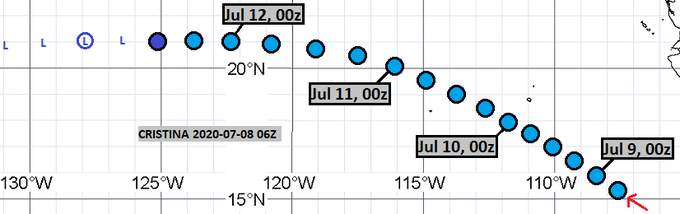
July 8, 06Z:
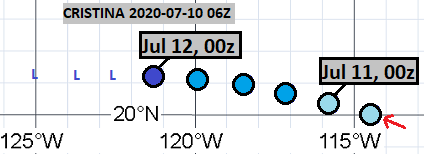
July 10, 06Z:
July 11, 12Z:

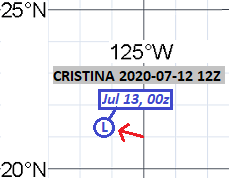
July 12, 12Z:
The complete misses were from the following model cycles:
June 18, 12Z
June 19, 06Z
June 20, 06Z
June 22, 06Z
As of this analysis, best track positions are available July 5, 18Z thru July 13, 00Z, and as such, position comparisons are possible only for this timespan.
Since I give only SSHS categories in my tracks, I don't calculate intensity errors in units of speed, but in categories. For this purpose, I define tropical or subtropical storms as "Category 0", tropical or subtropical depressions as "Category -1" and non-existence of a tropical or subtropical cyclone as "Category -2".
In the 19 tracks (made before operationally recognized cyclogenesis), formation times ranged between June 18, 06Z and July 8, 00Z. Average was June 30, 15Z and median was June 29, 12Z.
In the 24 cases (20 tracks, before the tracks and data agreed, that tropical storm would remain the peak intensity, and 4 complete misses), peak intensity ranged between Category -2 and Category 5. Average was Category 1.92 and median was Category 3.
In the 24 tracks (made before operationally recognized degeneration into remnant low), dissipation times ranged between June 24, 06Z and July 14, 18Z. Average was July 8, 06Z and median was July 7, 03Z.
At the lead time of 1 day (24 hours), there were 4 hits, 0 false detections and 0 misses. 4 available position comparisons produce an average error of 35 nautical miles.
At the lead time of 2 days (48 hours), there were 2 hits, 0 false detections and 1 miss. 2 available position comparisons produce an average error of 38 nautical miles.
At the lead time of 3 days (72 hours), there were 2 hits, 0 false detections and 0 misses. 2 available position comparisons produce an average error of 33 nautical miles.
At the lead time of 4 days (96 hours), there were 2 hits, 0 false detections and 0 misses. 2 available position comparisons produce an average error of 69 nautical miles.
At the lead time of 5 days (120 hours), there were 0 hits, 0 false detections and 1 miss. 1 available position comparison produces an average error of 58 nautical miles.
At the lead time of 6 days (144 hours), there were 0 hits, 0 false detections and 0 misses. No available position comparisons.
At the lead time of 7 days (168 hours), there were 0 hits, 0 false detections and 0 misses. No available position comparisons.
At the lead time of 8 days (192 hours), there were 0 hits, 2 false detections and 2 misses. No available position comparisons.
At the lead time of 9 days (216 hours), there were 1 hit, 4 false detections and 1 miss. 1 available position comparison produces an average error of 271 nautical miles.
At the lead time of 10 days (240 hours), there were 2 hits, 4 false detections and 0 misses. 3 available position comparisons produce an average error of 393 nautical miles.
At the lead time of 11 days (264 hours), there were 3 hits, 3 false detections and 0 misses. 4 available position comparisons produce an average error of 439 nautical miles.
At the lead time of 12 days (288 hours), there were 3 hits, 5 false detections and 1 miss. 3 available position comparisons produce an average error of 454 nautical miles.
At the lead time of 13 days (312 hours), there were 2 hits, 8 false detections and 3 misses. 3 available position comparisons produce an average error of 439 nautical miles.
At the lead time of 14 days (336 hours), there were 2 hits, 10 false detections and 3 misses. 2 available position comparisons produce an average error of 457 nautical miles.
At the lead time of 15 days (360 hours), there were 2 hits, 10 false detections and 4 misses. 3 available position comparisons produce an average error of 608 nautical miles.
At the lead time of 16 days (384 hours), there were 1 hit, 7 false detections and 6 misses. 2 available position comparisons produce an average error of 431 nautical miles.
At the lead time of 17 days (408 hours), there were 2 hits, 7 false detections and 5 misses. 2 available position comparisons produce an average error of 353 nautical miles.
At the lead time of 18 days (432 hours), there were 3 hits, 7 false detections and 5 misses. 4 available position comparisons produce an average error of 512 nautical miles.
At the lead time of 19 days (456 hours), there were 4 hits, 6 false detections and 5 misses. 4 available position comparisons produce an average error of 580 nautical miles.
At the lead time of 20 days (480 hours), there were 2 hits, 4 false detections and 7 misses. 2 available position comparisons produce an average error of 704 nautical miles.
Circle coloration scheme
Here are the tracks once again.
May 28, 12Z:
June 9, 12Z:
June 10, 12Z:
June 13, 12Z:
June 15, 00Z:
June 15, 12Z:
June 15, 18Z:
June 16, 12Z:
June 17, 06Z:
June 17, 18Z:
June 18, 06Z:
June 21, 06Z:
June 21, 12Z:
June 23, 12Z:
June 24, 06Z:
June 25, 06Z:
June 26, 06Z:
June 28, 18Z:
June 29, 12Z:
July 7, 12Z:
July 8, 06Z:
July 10, 06Z:
July 11, 12Z:
July 12, 12Z:
The complete misses were from the following model cycles:
June 18, 12Z
June 19, 06Z
June 20, 06Z
June 22, 06Z

Comments
Post a Comment