Verification of tracks made of Andres
I made 29 tracks of Tropical Storm Andres from 25 model cycles, before it was
assessed as
a tropical cyclone. In four model cycles, there were two non-contemporary tracks identifiable as Andres - from now on, those will be counted as one. I made two more tracks after cyclogenesis. Additionally, within 504 hours of cyclogenesis, there were 15 instances,
when I missed cyclogenesis entirely.
As of this analysis, best track positions are available May 6, 12Z
thru May 11, 12Z, and as such, position comparisons are possible only
for this timespan.
Since I give only SSHS categories in my tracks, I don't
calculate intensity errors in units of speed, but in categories. For
this purpose, I define tropical or subtropical storms as "Category 0", tropical
or subtropical depressions as "Category -1" and non-existence of a tropical or subtropical cyclone as
"Category -2".
In the 25 tracks (made before operationally recognized cyclogenesis),
formation times ranged between May 3, 12Z and May 11, 18Z. Average
was May 8, 10Z and median was May 8, 18Z.
In the 40 cases (25 tracks, before the tracks and data agreed,
that tropical storm would remain the peak intensity, and 15 complete
misses), peak intensity ranged between Category -2 and Category 3.
Average was Category -0.75 and median was Category 0.
In the 27 tracks (made before operationally recognized degeneration
into remnant low), dissipation times ranged between May 8, 06Z
and May 15, 18Z. Average was May 12, 01Z and median was May 12, 06Z.
At the lead time of 1 day (24 hours), there were 0 hits, 2 false detections and 2 misses. 1 available position comparison produces an average error of 50 nautical miles.
At the lead time of 2 days (48 hours), there were 3 hits, 0 false detections and 0 misses. 3 available position comparisons produce an average error of 36 nautical miles.
At the lead time of 3 days (72 hours), there were 1 hit, 3 false detections and 1 miss. 3 available position comparisons produce an average error of 68 nautical miles.
At the lead time of 4 days (96 hours), there were 3 hits, 2 false detections and 0 misses. 5 available position comparisons produce an average error of 72 nautical miles.
At the lead time of 5 days (120 hours), there were 3 hits, 1 false detection and 0 misses. 4 available position comparisons produce an average error of 129 nautical miles.
At the lead time of 6 days (144 hours), there were 3 hits, 5 false detections and 0 misses. 7 available position comparisons produce an average error of 138 nautical miles.
At the lead time of 7 days (168 hours), there were 3 hits, 2 false detections and 1 miss. 5 available position comparisons produce an average error of 159 nautical miles.
At the lead time of 8 days (192 hours), there were 2 hits, 2 false detections and 2 misses. 3 available position comparisons produce an average error of 170 nautical miles.
At the lead time of 9 days (216 hours), there were 1 hit, 1 false detection and 3 misses. 1 available position comparison produces an average error of 37 nautical miles.
At the lead time of 10 days (240 hours), there were 0 hits, 3 false detections and 4 misses. 1 available position comparison produces an average error of 233 nautical miles.
At the lead time of 11 days (264 hours), there were 3 hits, 2 false detections and 3 misses. 4 available position comparisons produce an average error of 276 nautical miles.
At the lead time of 12 days (288 hours), there were 0 hits, 6 false detections and 5 misses. 3 available position comparisons produce an average error of 295 nautical miles.
At the lead time of 13 days (312 hours), there were 0 hits, 5 false detections and 5 misses. 2 available position comparisons produce an average error of 254 nautical miles.
At the lead time of 14 days (336 hours), there were 5 hits, 3 false detections and 0 misses. 6 available position comparisons produce an average error of 283 nautical miles.
At the lead time of 15 days (360 hours), there were 5 hits, 3 false detections and 1 miss. 7 available position comparisons produce an average error of 237 nautical miles.
At the lead time of 16 days (384 hours), there were 0 hits, 6 false detections and 5 misses. 3 available position comparisons produce an average error of 227 nautical miles.
At the lead time of 17 days (408 hours), there were 0 hits, 1 false detection and 4 misses. No available position comparisons.
At the lead time of 18 days (432 hours), there were 0 hits, 0 false detections and 5 misses. No available position comparisons.
At the lead time of 19 days (456 hours), there were 0 hits, 0 false detections and 5 misses. No available position comparisons.
At the lead time of 20 days (480 hours), there were 0 hits, 0 false detections and 5 misses. No available position comparisons.
At the lead time of 21 days (504 hours), there were 0 hits, 0 false detections and 5 misses. No available position comparisons.
Circle coloration scheme

Here are the tracks once again.
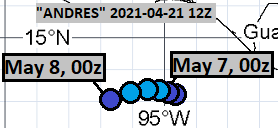
April 21, 12Z:
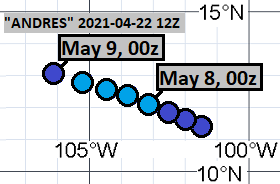
April 22, 12Z:
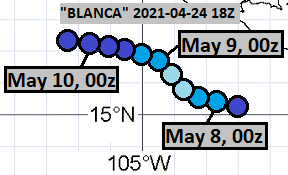
April 24, 18Z: (part 1)

April 24, 18Z: (part 2)
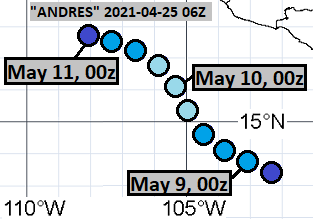
April 25, 06Z:
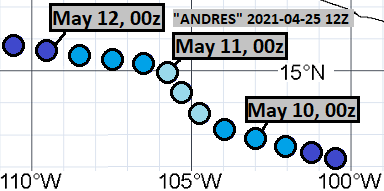
April 25, 12Z:
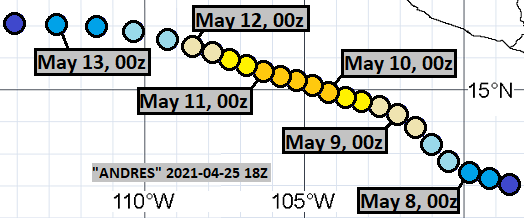
April 25, 18Z:
April 26, 06Z: (part 1)
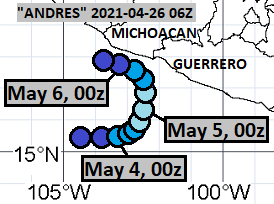
April 26, 06Z: (part 2)
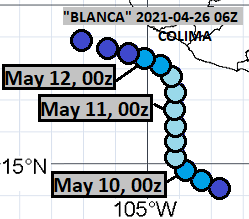
April 26, 12Z: (part 1)
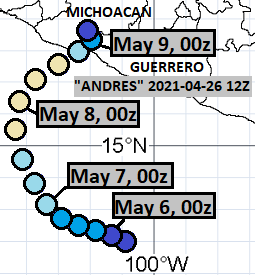
April 26, 12Z: (part 2)
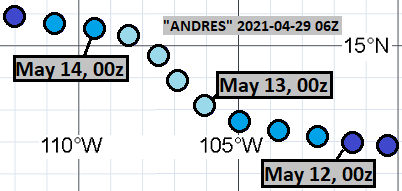
April 29, 06Z:
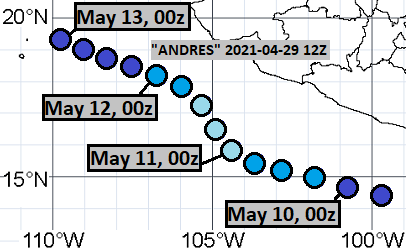
April 29, 12Z:
April 29, 18Z:

April 30, 06Z:

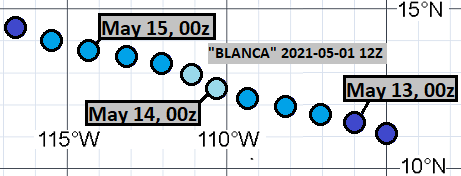
May 1, 12Z: (part 1)
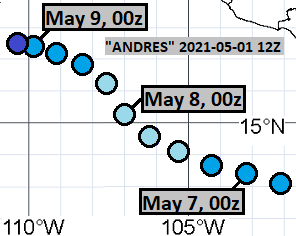
May 1, 12Z: (part 2)
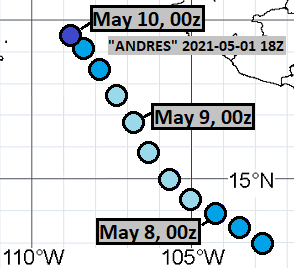
May 1, 18Z:
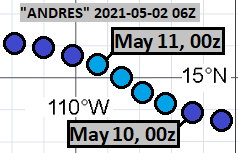
May 2, 06Z:
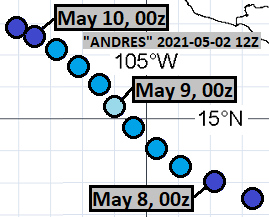
May 2, 12Z:
May 3, 12Z:

May 3, 18Z:

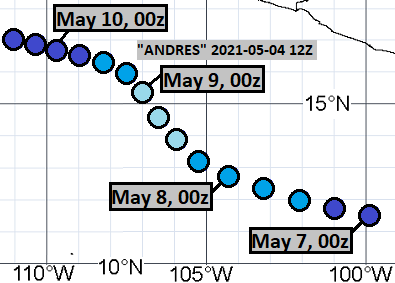
May 4, 12Z:
May 5, 12Z:

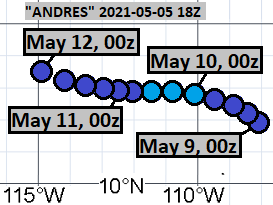
May 5, 18Z:
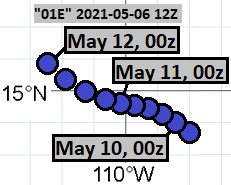
May 6, 12Z:
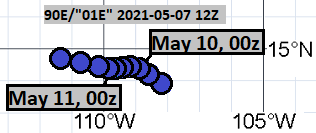
May 7, 12Z:
May 8, 12Z:

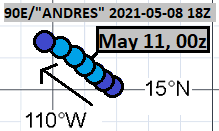
May 8, 18Z:
May 10, 12Z:

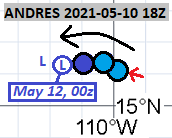
May 10, 18Z:
The complete misses were from the following model cycles:
April 18, 18Z
April 19, 00Z
April 19, 06Z
April 19, 12Z
April 20, 06Z
April 20, 12Z
April 21, 06Z
April 22, 06Z
April 23, 06Z
April 23, 12Z
April 24, 12Z
April 27, 12Z
April 27, 18Z
April 28, 06Z
April 28, 12Z

Comments
Post a Comment