Verification of tracks made of Claudette
I made 21 tracks of Tropical Storm Claudette,
before it was
assessed as
a tropical cyclone. I made two more tracks after cyclogenesis.
Additionally, within 504 hours of cyclogenesis, there were five instances,
when I missed cyclogenesis entirely.
As of this analysis, best track positions are available June 11, 18Z
thru June 22, 00Z, and as such, position comparisons are possible only
for this timespan. In the calculations, crossover to East Pacific is considered equal to dissipation.
Since I give only SSHS categories in my tracks, I don't
calculate intensity errors in units of speed, but in categories. For
this purpose, I define tropical or subtropical storms as "Category 0", tropical
or subtropical depressions as "Category -1" and non-existence of a tropical or subtropical cyclone as
"Category -2".
In the 21 tracks (made before operationally recognized cyclogenesis),
formation times ranged between June 7, 12Z and June 20, 00Z. Average
was June 16, 08Z and median was June 17, 12Z.
In the 26 cases (21 tracks, before the tracks and data agreed,
that tropical storm would remain the peak intensity, and 5 complete
misses), peak intensity ranged between Category -2 and Category 1.
Average was Category -0.50 and median was Category 0.
In the 23 tracks (made before operationally recognized degeneration), dissipation times ranged between June 9, 12Z
and June 22, 06Z. Average was June 19, 01Z and median was June 20, 06Z.
At the lead time of 1 day (24 hours), there were 0 hits, 0 false detections and 1 miss. 1 available position comparison produces an average error of 55 nautical miles.
At the lead time of 2 days (48 hours), there were 2 hits, 4 false detections and 0 misses. 6 available position comparisons produce an average error of 65 nautical miles.
At the lead time of 3 days (72 hours), there were 2 hits, 2 false detections and 2 misses. 5 available position comparisons produce an average error of 165 nautical miles.
At the lead time of 4 days (96 hours), there were 3 hits, 2 false detections and 3 misses. 6 available position comparisons produce an average error of 229 nautical miles.
At the lead time of 5 days (120 hours), there were 2 hits, 1 false detection and 4 misses. 3 available position comparisons produce an average error of 348 nautical miles.
At the lead time of 6 days (144 hours), there were 2 hits, 0 false detections and 2 misses. 2 available position comparisons produce an average error of 366 nautical miles.
At the lead time of 7 days (168 hours), there were 1 hit, 1 false detection and 2 misses. 3 available position comparisons produce an average error of 416 nautical miles.
At the lead time of 8 days (192 hours), there were 1 hit, 1 false detection and 1 miss. 2 available position comparisons produce an average error of 366 nautical miles.
At the lead time of 9 days (216 hours), there were 1 hit, 3 false detections and 2 misses. 4 available position comparisons produce an average error of 373 nautical miles.
At the lead time of 10 days (240 hours), there were 2 hits, 2 false detections and 2 misses. 4 available position comparisons produce an average error of 433 nautical miles.
At the lead time of 11 days (264 hours), there were 1 hit, 3 false detections and 3 misses. 3 available position comparisons produce an average error of 494 nautical miles.
At the lead time of 12 days (288 hours), there were 0 hits, 3 false detections and 6 misses. 2 available position comparisons produce an average error of 381 nautical miles.
At the lead time of 13 days (312 hours), there were 1 hit, 3 false detections and 5 misses. 1 available position comparison produces an average error of 121 nautical miles.
At the lead time of 14 days (336 hours), there were 1 hit, 3 false detections and 5 misses. 3 available position comparisons produce an average error of 331 nautical miles.
At the lead time of 15 days (360 hours), there were 0 hits, 2 false detections and 4 misses. 2 available position comparisons produce an average error of 399 nautical miles.
At the lead time of 16 days (384 hours), there were 1 hit, 2 false detections and 1 mis. 3 available position comparisons produce an average error of 643 nautical miles.
At the lead time of 17 days (408 hours), there were 1 hit, 1 false detection and 1 miss. 2 available position comparisons produce an average error of 1006 nautical miles.
At the lead time of 18 days (432 hours), there were 0 hits, 1 false detection and 1 miss. 1 available position comparison produces an average error of 779 nautical miles.
At the lead time of 19 days (456 hours), there were 0 hits, 0 false detections and 2 misses. No available position comparisons.
At the lead time of 20 days (480 hours), there were 0 hits, 0 false detections and 1 miss. No available position comparisons.
At the lead time of 21 days (504 hours), there were 0 hits, 0 false detections and 2 misses. No available position comparisons.
Circle coloration scheme

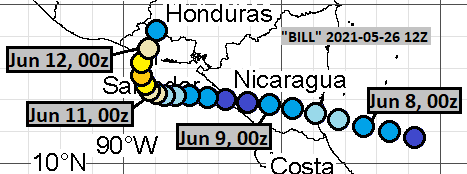
Here are the tracks once again.
May 26, 12Z:
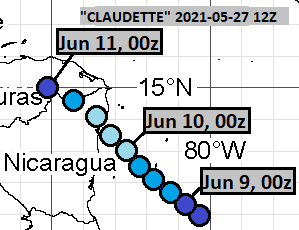
May 27, 12Z:
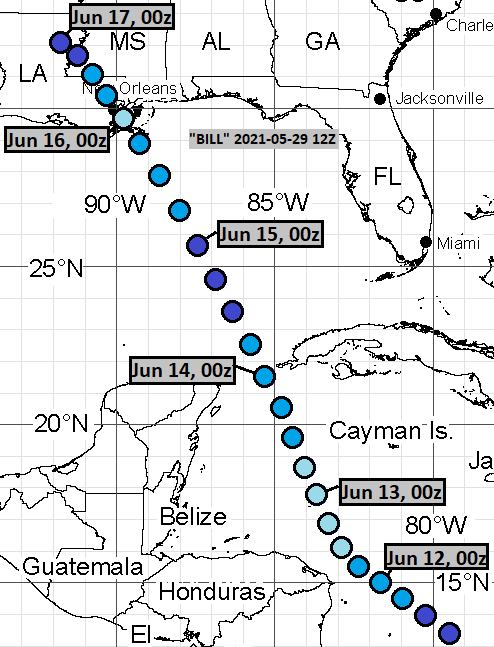
May 29, 12Z:
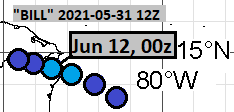
May 31, 12Z:
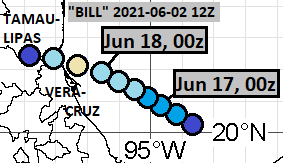
June 2, 12Z:
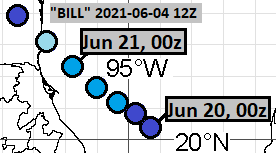
June 4, 12Z:
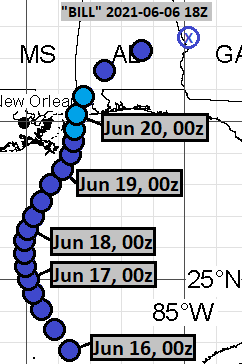
June 6, 18Z:
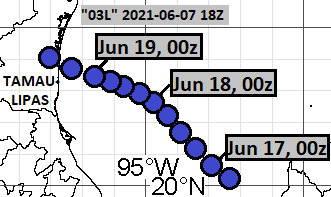
June 7, 18Z:
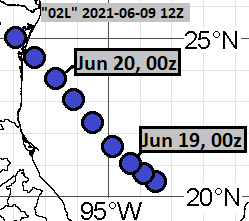
June 9, 12Z:
June 9, 18Z:

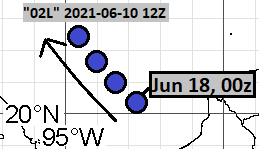
June 10, 12Z:
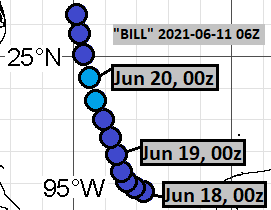
June 11, 06Z:
June 12, 12Z:

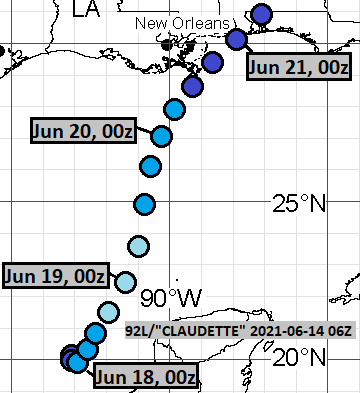
June 14, 06Z:
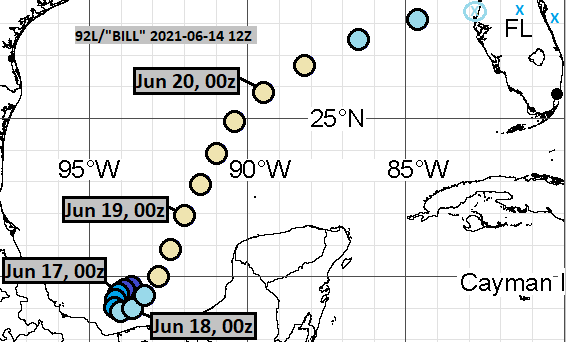
June 14, 12Z:
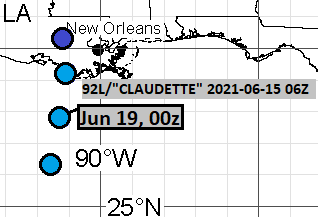
June 15, 06Z:
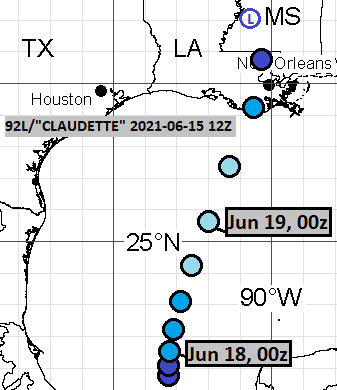
June 15, 12Z:
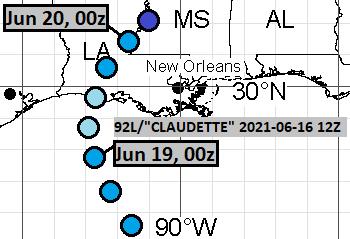
June 16, 06Z:
June 16, 12Z:
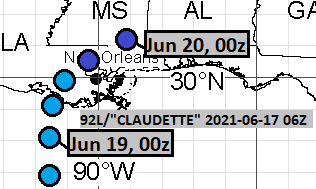
June 17, 06Z:
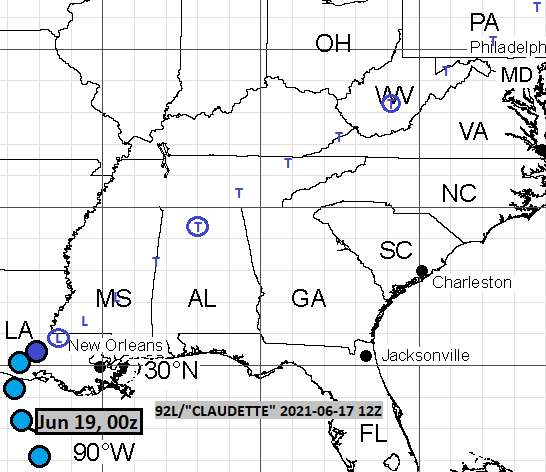
June 17, 12Z:
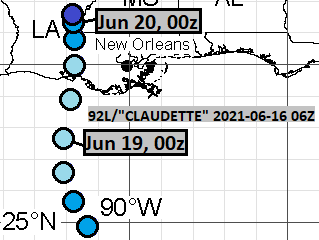
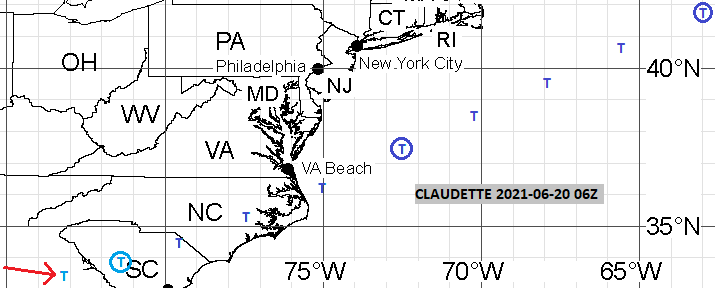
June 20, 06Z:
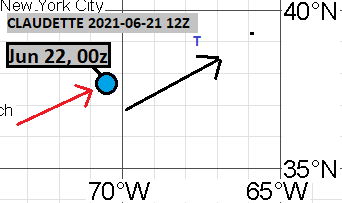
June 21, 12Z:
The complete misses were from the following model cycles:
June 5, 12Z
June 6, 12Z
June 7, 06Z
June 7, 12Z
June 8, 12Z

Comments
Post a Comment