Total verification of tracks done in 2019 in North Atlantic
These tracks, or lack of those, have been earlier discussed in separate blog entries system-wise or time-wise:
Andrea
Barry
TD 3
Chantal
Dorian
Erin
Fernand
Gabrielle
Humberto
Imelda
Jerry
Karen
Lorenzo
Melissa
TD 15
Nestor
Olga
Pablo
Rebekah
Sebastien
ghost storms Jan-May
ghost storms Jun-Jul
ghost storms Aug-Oct
ghost storms Nov-Dec
In 2019, I analysed 721 GEFS runs.
I made 74 tracks of storms, that actually formed.
I made 296 tracks of ghost storms.
I missed 218 times cyclogenesis, which actually happened within 384 hours.
At the lead time of 1 day (24 hours), there were 6 hits, 10 false detections and 8 misses. 10 available position comparisons produce an average error of 55 nautical miles.
At the lead time of 2 days (48 hours), there were 10 hits, 14 false detections and 14 misses. 14 available position comparisons produce an average error of 84 nautical miles.
At the lead time of 3 days (72 hours), there were 9 hits, 16 false detections and 24 misses. 10 available position comparisons produce an average error of 140 nautical miles.
At the lead time of 4 days (96 hours), there were 13 hits, 23 false detections and 28 misses. 15 available position comparisons produce an average error of 170 nautical miles.
At the lead time of 5 days (120 hours), there were 12 hits, 33 false detections and 35 misses. 15 available position comparisons produce an average error of 201 nautical miles.
At the lead time of 6 days (144 hours), there were 14 hits, 36 false detections and 36 misses. 15 available position comparisons produce an average error of 230 nautical miles.
At the lead time of 7 days (168 hours), there were 17 hits, 39 false detections and 29 misses. 18 available position comparisons produce an average error of 272 nautical miles.
At the lead time of 8 days (192 hours), there were 18 hits, 42 false detections and 42 misses. 18 available position comparisons produce an average error of 357 nautical miles.
At the lead time of 9 days (216 hours), there were 16 hits, 53 false detections and 40 misses. 18 available position comparisons produce an average error of 415 nautical miles.
At the lead time of 10 days (240 hours), there were 12 hits, 70 false detections and 46 misses. 13 available position comparisons produce an average error of 551 nautical miles.
At the lead time of 11 days (264 hours), there were 12 hits, 110 false detections and 50 misses. 13 available position comparisons produce an average error of 609 nautical miles.
At the lead time of 12 days (288 hours), there were 12 hits, 131 false detections and 56 misses. 15 available position comparisons produce an average error of 585 nautical miles.
At the lead time of 13 days (312 hours), there were 10 hits, 141 false detections and 52 misses. 14 available position comparisons produce an average error of 638 nautical miles.
At the lead time of 14 days (336 hours), there were 12 hits, 140 false detections and 54 misses. 16 available position comparisons produce an average error of 662 nautical miles.
At the lead time of 15 days (360 hours), there were 11 hits, 132 false detections and 60 misses. 15 available position comparisons produce an average error of 617 nautical miles.
At the lead time of 16 days (384 hours), there were 15 hits, 151 false detections and 59 misses. 17 available position comparisons produce an average error of 681 nautical miles.
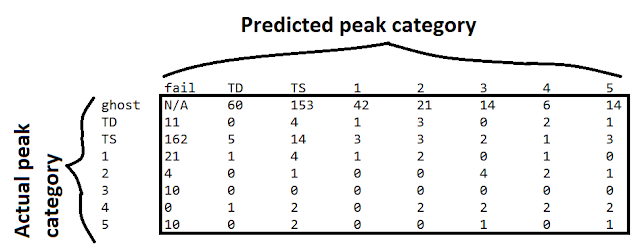
The table below shows the number of cases, where a track with a certain peak intensity ended up actually peaking with a certain intensity.
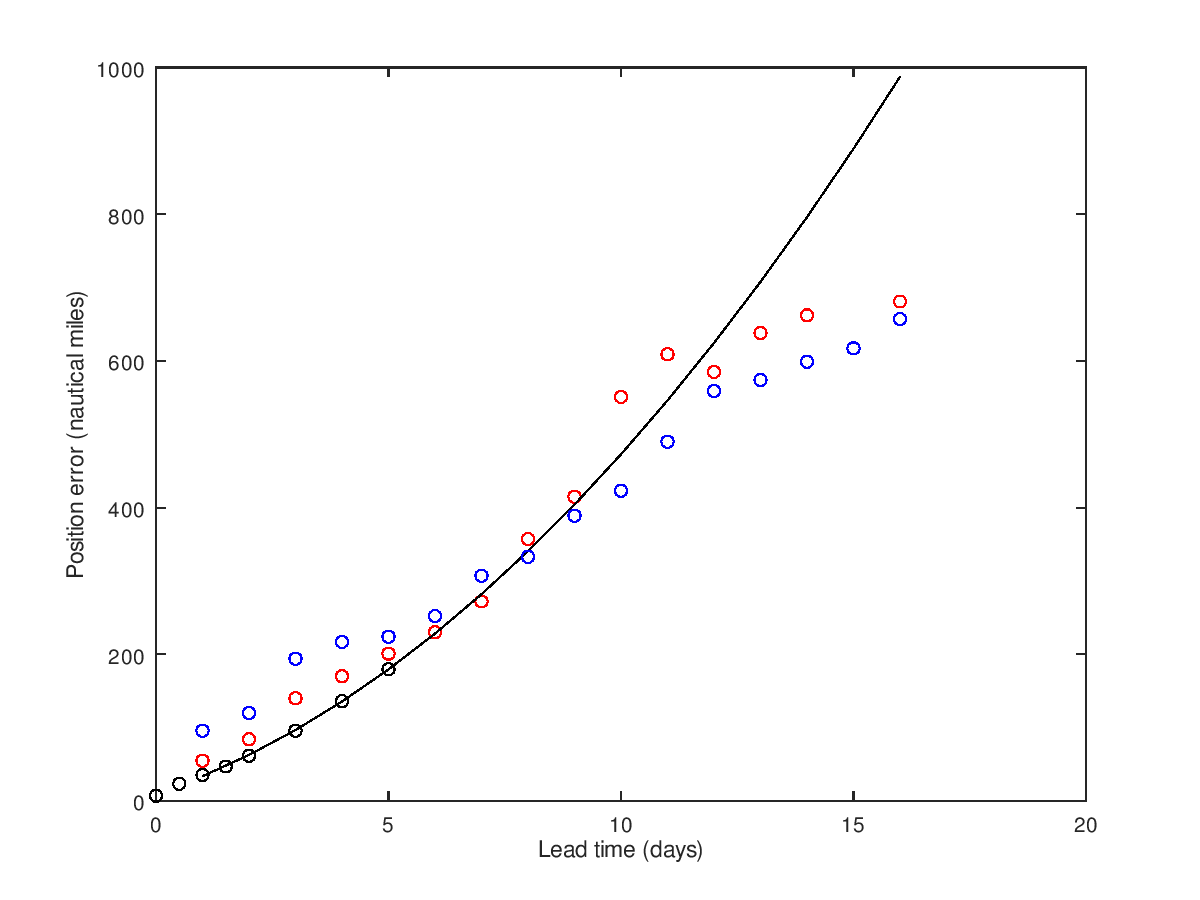
The graph below shows the average position errors of my tracks in 2019 in red circles, the position errors of 2018 Atlantic tracks in blue circles, NHC average forecast errors 2014-2018 in black circles, and a quadratic fit to NHC errors as black line.

The graph below shows a 30-day average of hits (in black), false detections (in red) and misses (in blue), calculated from analysed GEFS runs and interpolated values for the runs, that were skipped.
 The following is otherwise the same as the previous, but the average is weekly.

Andrea
Barry
TD 3
Chantal
Dorian
Erin
Fernand
Gabrielle
Humberto
Imelda
Jerry
Karen
Lorenzo
Melissa
TD 15
Nestor
Olga
Pablo
Rebekah
Sebastien
ghost storms Jan-May
ghost storms Jun-Jul
ghost storms Aug-Oct
ghost storms Nov-Dec
In 2019, I analysed 721 GEFS runs.
I made 74 tracks of storms, that actually formed.
I made 296 tracks of ghost storms.
I missed 218 times cyclogenesis, which actually happened within 384 hours.
At the lead time of 1 day (24 hours), there were 6 hits, 10 false detections and 8 misses. 10 available position comparisons produce an average error of 55 nautical miles.
At the lead time of 2 days (48 hours), there were 10 hits, 14 false detections and 14 misses. 14 available position comparisons produce an average error of 84 nautical miles.
At the lead time of 3 days (72 hours), there were 9 hits, 16 false detections and 24 misses. 10 available position comparisons produce an average error of 140 nautical miles.
At the lead time of 4 days (96 hours), there were 13 hits, 23 false detections and 28 misses. 15 available position comparisons produce an average error of 170 nautical miles.
At the lead time of 5 days (120 hours), there were 12 hits, 33 false detections and 35 misses. 15 available position comparisons produce an average error of 201 nautical miles.
At the lead time of 6 days (144 hours), there were 14 hits, 36 false detections and 36 misses. 15 available position comparisons produce an average error of 230 nautical miles.
At the lead time of 7 days (168 hours), there were 17 hits, 39 false detections and 29 misses. 18 available position comparisons produce an average error of 272 nautical miles.
At the lead time of 8 days (192 hours), there were 18 hits, 42 false detections and 42 misses. 18 available position comparisons produce an average error of 357 nautical miles.
At the lead time of 9 days (216 hours), there were 16 hits, 53 false detections and 40 misses. 18 available position comparisons produce an average error of 415 nautical miles.
At the lead time of 10 days (240 hours), there were 12 hits, 70 false detections and 46 misses. 13 available position comparisons produce an average error of 551 nautical miles.
At the lead time of 11 days (264 hours), there were 12 hits, 110 false detections and 50 misses. 13 available position comparisons produce an average error of 609 nautical miles.
At the lead time of 12 days (288 hours), there were 12 hits, 131 false detections and 56 misses. 15 available position comparisons produce an average error of 585 nautical miles.
At the lead time of 13 days (312 hours), there were 10 hits, 141 false detections and 52 misses. 14 available position comparisons produce an average error of 638 nautical miles.
At the lead time of 14 days (336 hours), there were 12 hits, 140 false detections and 54 misses. 16 available position comparisons produce an average error of 662 nautical miles.
At the lead time of 15 days (360 hours), there were 11 hits, 132 false detections and 60 misses. 15 available position comparisons produce an average error of 617 nautical miles.
At the lead time of 16 days (384 hours), there were 15 hits, 151 false detections and 59 misses. 17 available position comparisons produce an average error of 681 nautical miles.
The table below shows the number of cases, where a track with a certain peak intensity ended up actually peaking with a certain intensity.

The graph below shows the average position errors of my tracks in 2019 in red circles, the position errors of 2018 Atlantic tracks in blue circles, NHC average forecast errors 2014-2018 in black circles, and a quadratic fit to NHC errors as black line.
The graph below shows a 30-day average of hits (in black), false detections (in red) and misses (in blue), calculated from analysed GEFS runs and interpolated values for the runs, that were skipped.


Comments
Post a Comment