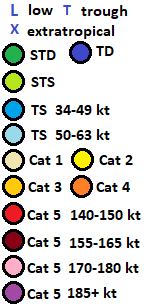
Total verification of tracks done in 2021 in North Atlantic
Above: Possibly the most ridiculous Atlantic track of 2021. Yes, Sam became strong. But 200 mph? Nah.
These tracks, or lack of those, have been earlier discussed in separate blog entries system-wise or time-wise:
Ana
Bill
Claudette
Danny
Elsa
Fred
Grace
Henri
Ida
Kate
Julian
Larry
Mindy
Nicholas
Odette
Peter
Rose
Sam
Teresa
Victor
Wanda
ghost storms Jan-May
ghost storms Jun-Jul
ghost storms Aug-Oct
ghost storms Nov-Dec
In 2021, I analysed 328 model cycles.
I made 60 tracks of storms, that actually formed later.
I made 110 tracks of ghost storms.
I missed 249 times cyclogenesis, which actually happened within 504 hours.
At the lead time of 1 day (24 hours), there were 22 hits, 9 false detections and 7 misses. 31 available position comparisons produce an average error of 59 nautical miles.
At the lead time of 2 days (48 hours), there were 20 hits, 22 false detections and 12 misses. 39 available position comparisons produce an average error of 92 nautical miles.
At the lead time of 3 days (72 hours), there were 21 hits, 16 false detections and 16 misses. 34 available position comparisons produce an average error of 186 nautical miles.
At the lead time of 4 days (96 hours), there were 20 hits, 13 false detections and 22 misses. 35 available position comparisons produce an average error of 213 nautical miles.
At the lead time of 5 days (120 hours), there were 14 hits, 9 false detections and 31 misses. 21 available position comparisons produce an average error of 263 nautical miles.
At the lead time of 6 days (144 hours), there were 14 hits, 14 false detections and 27 misses. 18 available position comparisons produce an average error of 338 nautical miles.
At the lead time of 7 days (168 hours), there were 13 hits, 14 false detections and 28 misses. 17 available position comparisons produce an average error of 429 nautical miles.
At the lead time of 8 days (192 hours), there were 11 hits, 13 false detections and 32 misses. 14 available position comparisons produce an average error of 511 nautical miles.
At the lead time of 9 days (216 hours), there were 9 hits, 15 false detections and 32 misses. 14 available position comparisons produce an average error of 565 nautical miles.
At the lead time of 10 days (240 hours), there were 7 hits, 16 false detections and 34 misses. 11 available position comparisons produce an average error of 592 nautical miles.
At the lead time of 11 days (264 hours), there were 5 hits, 16 false detections and 37 misses. 8 available position comparisons produce an average error of 656 nautical miles.
At the lead time of 12 days (288 hours), there were 3 hits, 16 false detections and 41 misses. 6 available position comparisons produce an average error of 609 nautical miles.
At the lead time of 13 days (312 hours), there were 4 hits, 24 false detections and 41 misses. 6 available position comparisons produce an average error of 750 nautical miles.
At the lead time of 14 days (336 hours), there were 4 hits, 20 false detections and 45 misses. 7 available position comparisons produce an average error of 686 nautical miles.
At the lead time of 15 days (360 hours), there were 3 hits, 21 false detections and 48 misses. 5 available position comparisons produce an average error of 691 nautical miles.
At the lead time of 16 days (384 hours), there were 5 hits, 21 false detections and 46 misses. 7 available position comparisons produce an average error of 796 nautical miles.
At the lead time of 17 days (408 hours), there were 2 hits, 21 false detections and 52 misses. 3 available position comparisons produce an average error of 1010 nautical miles.
At the lead time of 18 days (432 hours), there were 2 hits, 28 false detections and 55 misses. 4 available position comparisons produce an average error of 670 nautical miles.
At the lead time of 19 days (456 hours), there were 1 hit, 30 false detections and 59 misses. 2 available position comparisons produce an average error of 273 nautical miles.
At the lead time of 20 days (480 hours), there were 0 hits, 27 false detections and 59 misses. 1 available position comparison produces an average error of 418 nautical miles.
At the lead time of 21 days (504 hours), there were 0 hits, 14 false detections and 59 misses. 1 available position comparison produces an average error of 764 nautical miles.
The table below shows the number of cases, where a track with a certain peak intensity ended up actually peaking with a certain intensity.
The graph below shows my average Atlantic track errors of latest four years, as well as a quadratic fit to NHC errors.
The graph below shows a 30-day average of hits (in black), false detections (in red) and misses (in blue), calculated from analysed model cycles and interpolated values for the model cycles, that were skipped.
The following is otherwise the same as the previous, but the average is weekly.


Comments
Post a Comment