Total verification of tracks done in 2021 in Eastern Pacific
These tracks, or lack of those, have been earlier discussed in separate blog entries system-wise or time-wise:
Andres
Blanca
Carlos
Dolores
Enrique
Felicia
Guillermo
Hilda
Jimena
Ignacio
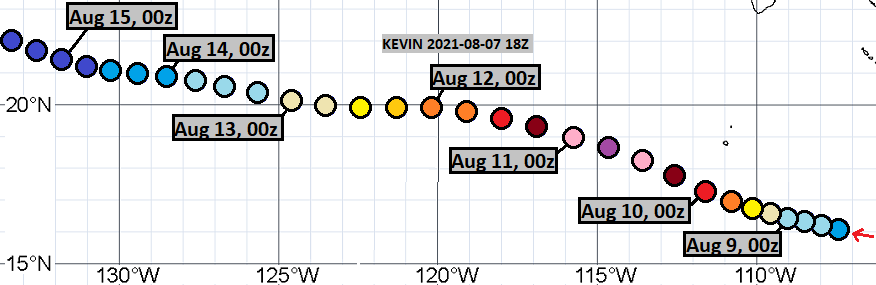
Kevin
Linda
Marty
Nora
Olaf
Pamela
Rick
Terry
Sandra
ghost storms Jan-May
ghost storms Jun-Jul
ghost storms Aug-Oct
ghost storms Nov-Dec
In 2021, I analysed 328 model cycles.
I made 158 tracks of storms, that actually formed later.
I made 105 tracks of ghost storms.
I missed 150 times cyclogenesis, which actually happened within 504 hours.
At the lead time of 1 day (24 hours), there were 30 hits, 15 false detections and 5 misses. 43 available position comparisons produce an average error of 53 nautical miles.
At the lead time of 2 days (48 hours), there were 41 hits, 17 false detections and 2 misses. 49 available position comparisons produce an average error of 82 nautical miles.
At the lead time of 3 days (72 hours), there were 33 hits, 24 false detections and 9 misses. 46 available position comparisons produce an average error of 133 nautical miles.
At the lead time of 4 days (96 hours), there were 34 hits, 22 false detections and 20 misses. 48 available position comparisons produce an average error of 187 nautical miles.
At the lead time of 5 days (120 hours), there were 30 hits, 31 false detections and 20 misses. 50 available position comparisons produce an average error of 216 nautical miles.
At the lead time of 6 days (144 hours), there were 29 hits, 41 false detections and 28 misses. 50 available position comparisons produce an average error of 271 nautical miles.
At the lead time of 7 days (168 hours), there were 30 hits, 36 false detections and 34 misses. 48 available position comparisons produce an average error of 304 nautical miles.
At the lead time of 8 days (192 hours), there were 27 hits, 38 false detections and 36 misses. 42 available position comparisons produce an average error of 310 nautical miles.
At the lead time of 9 days (216 hours), there were 24 hits, 39 false detections and 37 misses. 34 available position comparisons produce an average error of 295 nautical miles.
At the lead time of 10 days (240 hours), there were 18 hits, 46 false detections and 38 misses. 28 available position comparisons produce an average error of 320 nautical miles.
At the lead time of 11 days (264 hours), there were 20 hits, 55 false detections and 41 misses. 29 available position comparisons produce an average error of 292 nautical miles.
At the lead time of 12 days (288 hours), there were 20 hits, 48 false detections and 41 misses. 25 available position comparisons produce an average error of 288 nautical miles.
At the lead time of 13 days (312 hours), there were 12 hits, 59 false detections and 48 misses. 19 available position comparisons produce an average error of 325 nautical miles.
At the lead time of 14 days (336 hours), there were 15 hits, 50 false detections and 45 misses. 18 available position comparisons produce an average error of 357 nautical miles.
At the lead time of 15 days (360 hours), there were 13 hits, 57 false detections and 41 misses. 22 available position comparisons produce an average error of 290 nautical miles.
At the lead time of 16 days (384 hours), there were 6 hits, 51 false detections and 50 misses. 14 available position comparisons produce an average error of 321 nautical miles.
At the lead time of 17 days (408 hours), there were 9 hits, 46 false detections and 39 misses. 14 available position comparisons produce an average error of 472 nautical miles.
At the lead time of 18 days (432 hours), there were 10 hits, 46 false detections and 52 misses. 13 available position comparisons produce an average error of 457 nautical miles.
At the lead time of 19 days (456 hours), there were 6 hits, 43 false detections and 62 misses. 10 available position comparisons produce an average error of 419 nautical miles.
At the lead time of 20 days (480 hours), there were 4 hits, 35 false detections and 64 misses. 6 available position comparisons produce an average error of 532 nautical miles.
At the lead time of 21 days (504 hours), there were 3 hits, 25 false detections and 64 misses. 4 available position comparisons produce an average error of 542 nautical miles.
The table below shows the number of cases, where a track with a certain peak intensity ended up actually peaking with a certain intensity.

The graph below shows my average Eastern Pacific track errors of latest three years, as well as a quadratic fit to NHC errors.

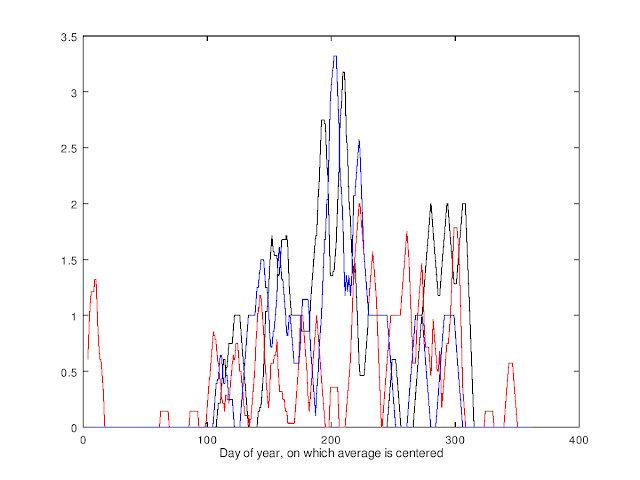
The graph below shows a 30-day average of hits (in black), false detections (in red) and misses (in blue), calculated from analysed model cycles and interpolated values for the model cycles, that were skipped.

Comments
Post a Comment