Total verification of tracks done in 2018
These tracks, or lack of those, have been earlier discussed in separate blog entries system-wise or time-wise:
Alberto
Beryl
Chris
Debby
Ernesto
Florence
Gordon
Helene
Isaac
Joyce
TD 11
Kirk
Leslie
Michael
Nadine
Oscar
Ghost storms Jan-Mar
Ghost storms Apr-May
Ghost storms Jun
Ghost storms Jul
Ghost storms Aug
Ghost storms Sep-Oct
Ghost storms Nov
December had no ghost storm tracks.
Xenophon
Since this total verification includes only North Atlantic systems, Xenophon is omitted.
I made 285 tracks of storms, that actually formed.
I made 457 tracks of ghost storms.
I missed 257 times cyclogenesis, which actually happened within 384 hours.
At the lead time of 1 day (24 hours), there were 7 hits, 18 false detections and 13 misses. 17 available position comparisons produce an average error of 96 nautical miles.
At the lead time of 2 days (48 hours), there were 19 hits, 34 false detections and 30 misses. 29 available position comparisons produce an average error of 120 nautical miles.
At the lead time of 3 days (72 hours), there were 23 hits, 42 false detections and 54 misses. 29 available position comparisons produce an average error of 194 nautical miles.
At the lead time of 4 days (96 hours), there were 27 hits, 50 false detections and 65 misses. 39 available position comparisons produce an average error of 217 nautical miles.
At the lead time of 5 days (120 hours), there were 31 hits, 58 false detections and 74 misses. 40 available position comparisons produce an average error of 224 nautical miles.
At the lead time of 6 days (144 hours), there were 32 hits, 90 false detections and 80 misses. 53 available position comparisons produce an average error of 252 nautical miles.
At the lead time of 7 days (168 hours), there were 39 hits, 100 false detections and 84 misses. 62 available position comparisons produce an average error of 307 nautical miles.
At the lead time of 8 days (192 hours), there were 41 hits, 105 false detections and 84 misses. 65 available position comparisons produce an average error of 333 nautical miles.
At the lead time of 9 days (216 hours), there were 37 hits, 104 false detections and 97 misses. 69 available position comparisons produce an average error of 389 nautical miles.
At the lead time of 10 days (240 hours), there were 42 hits, 130 false detections and 97 misses. 68 available position comparisons produce an average error of 423 nautical miles.
At the lead time of 11 days (264 hours), there were 46 hits, 177 false detections and 102 misses. 78 available position comparisons produce an average error of 490 nautical miles.
At the lead time of 12 days (288 hours), there were 53 hits, 199 false detections and 109 misses. 84 available position comparisons produce an average error of 559 nautical miles.
At the lead time of 13 days (312 hours), there were 52 hits, 208 false detections and 121 misses. 78 available position comparisons produce an average error of 574 nautical miles.
At the lead time of 14 days (336 hours), there were 53 hits, 207 false detections and 122 misses. 74 available position comparisons produce an average error of 599 nautical miles.
At the lead time of 15 days (360 hours), there were 58 hits, 211 false detections and 121 misses. 79 available position comparisons produce an average error of 617 nautical miles.
At the lead time of 16 days (384 hours), there were 53 hits, 224 false detections and 136 misses. 79 available position comparisons produce an average error of 657 nautical miles.
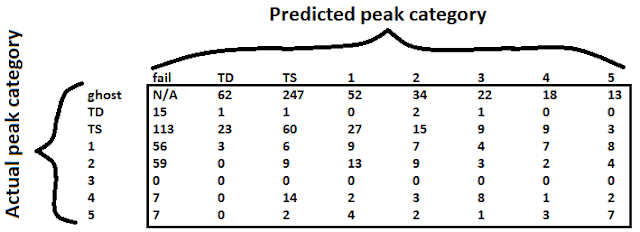
The table below shows the number of cases, where a track with a certain peak intensity ended up actually peaking with a certain intensity.
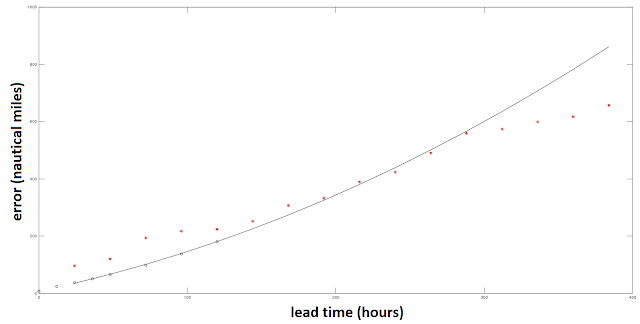
The graph below shows the average position errors of my tracks in red circles, NHC average forecast errors 2013-2017 in black circles, and a rough quadratic fit to NHC errors as black line.
Alberto
Beryl
Chris
Debby
Ernesto
Florence
Gordon
Helene
Isaac
Joyce
TD 11
Kirk
Leslie
Michael
Nadine
Oscar
Ghost storms Jan-Mar
Ghost storms Apr-May
Ghost storms Jun
Ghost storms Jul
Ghost storms Aug
Ghost storms Sep-Oct
Ghost storms Nov
December had no ghost storm tracks.
Xenophon
Since this total verification includes only North Atlantic systems, Xenophon is omitted.
I made 285 tracks of storms, that actually formed.
I made 457 tracks of ghost storms.
I missed 257 times cyclogenesis, which actually happened within 384 hours.
At the lead time of 1 day (24 hours), there were 7 hits, 18 false detections and 13 misses. 17 available position comparisons produce an average error of 96 nautical miles.
At the lead time of 2 days (48 hours), there were 19 hits, 34 false detections and 30 misses. 29 available position comparisons produce an average error of 120 nautical miles.
At the lead time of 3 days (72 hours), there were 23 hits, 42 false detections and 54 misses. 29 available position comparisons produce an average error of 194 nautical miles.
At the lead time of 4 days (96 hours), there were 27 hits, 50 false detections and 65 misses. 39 available position comparisons produce an average error of 217 nautical miles.
At the lead time of 5 days (120 hours), there were 31 hits, 58 false detections and 74 misses. 40 available position comparisons produce an average error of 224 nautical miles.
At the lead time of 6 days (144 hours), there were 32 hits, 90 false detections and 80 misses. 53 available position comparisons produce an average error of 252 nautical miles.
At the lead time of 7 days (168 hours), there were 39 hits, 100 false detections and 84 misses. 62 available position comparisons produce an average error of 307 nautical miles.
At the lead time of 8 days (192 hours), there were 41 hits, 105 false detections and 84 misses. 65 available position comparisons produce an average error of 333 nautical miles.
At the lead time of 9 days (216 hours), there were 37 hits, 104 false detections and 97 misses. 69 available position comparisons produce an average error of 389 nautical miles.
At the lead time of 10 days (240 hours), there were 42 hits, 130 false detections and 97 misses. 68 available position comparisons produce an average error of 423 nautical miles.
At the lead time of 11 days (264 hours), there were 46 hits, 177 false detections and 102 misses. 78 available position comparisons produce an average error of 490 nautical miles.
At the lead time of 12 days (288 hours), there were 53 hits, 199 false detections and 109 misses. 84 available position comparisons produce an average error of 559 nautical miles.
At the lead time of 13 days (312 hours), there were 52 hits, 208 false detections and 121 misses. 78 available position comparisons produce an average error of 574 nautical miles.
At the lead time of 14 days (336 hours), there were 53 hits, 207 false detections and 122 misses. 74 available position comparisons produce an average error of 599 nautical miles.
At the lead time of 15 days (360 hours), there were 58 hits, 211 false detections and 121 misses. 79 available position comparisons produce an average error of 617 nautical miles.
At the lead time of 16 days (384 hours), there were 53 hits, 224 false detections and 136 misses. 79 available position comparisons produce an average error of 657 nautical miles.
The table below shows the number of cases, where a track with a certain peak intensity ended up actually peaking with a certain intensity.

The graph below shows the average position errors of my tracks in red circles, NHC average forecast errors 2013-2017 in black circles, and a rough quadratic fit to NHC errors as black line.


Comments
Post a Comment