Total verification of tracks done in 2020 in North Atlantic
These tracks, or lack of those, have been earlier discussed in separate blog entries system-wise or time-wise:
Arthur
Bertha
Cristobal
Dolly
Edouard
Fay
Gonzalo
Hanna
Isaias
TD 10
Josephine
Kyle
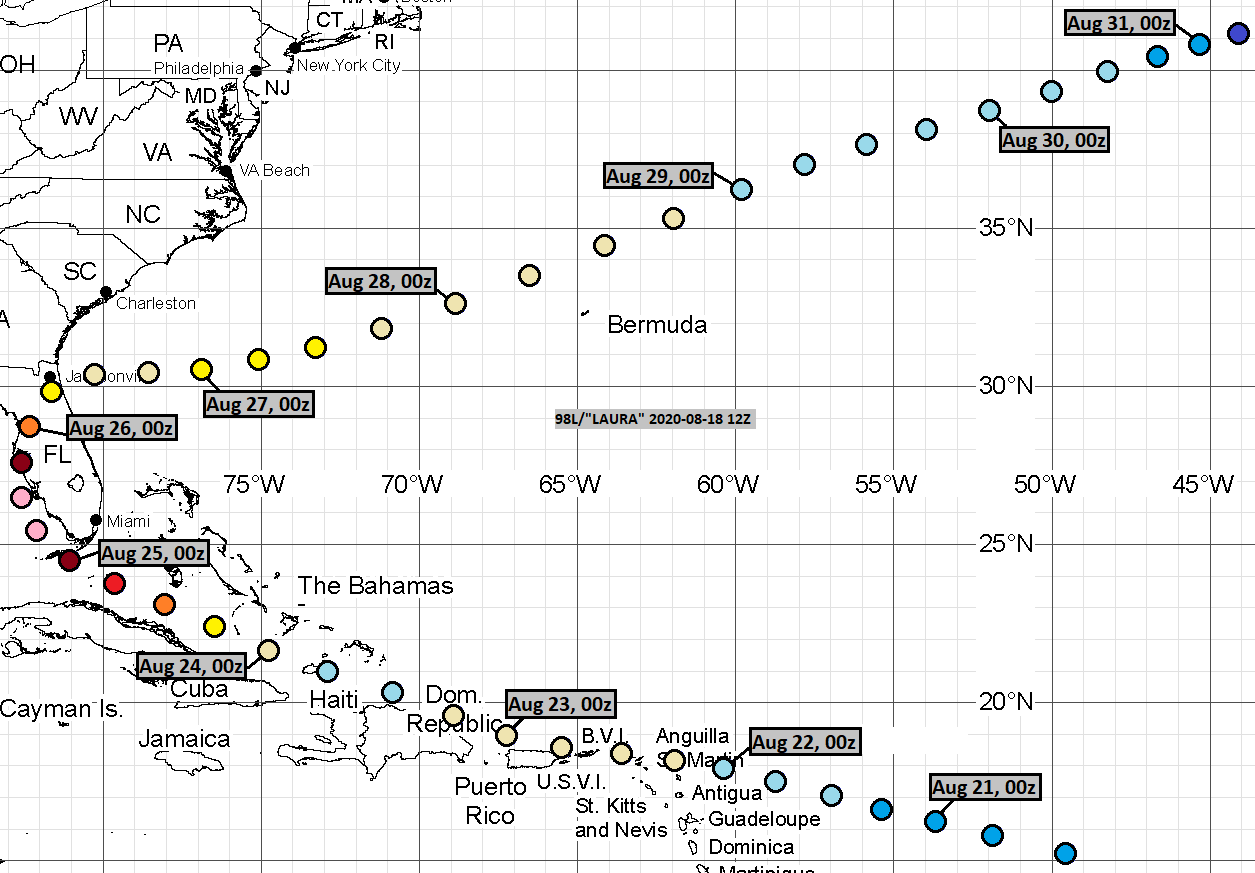
Laura
Marco
Omar
Nana
Paulette
Rene
Sally
Teddy
Vicky
Beta
Wilfred
Alpha
Gamma
Delta
Epsilon
Zeta
Eta
Theta
Iota
ghost storms Jan-May
ghost storm Jun-Jul
ghost storms Aug-Oct
ghost storms Nov-Dec
In 2020, I analysed 557 model cycles.
I made 196 tracks of storms, that actually formed later.
I made 261 tracks of ghost storms.
I missed 295 times cyclogenesis, which actually happened within 480 hours.
At the lead time of 1 day (24 hours), there were 57 hits, 20 false detections and 12 misses. 77 available position comparisons produce an average error of 47 nautical miles.
At the lead time of 2 days (48 hours), there were 56 hits, 24 false detections and 19 misses. 72 available position comparisons produce an average error of 91 nautical miles.
At the lead time of 3 days (72 hours), there were 47 hits, 28 false detections and 30 misses. 63 available position comparisons produce an average error of 124 nautical miles.
At the lead time of 4 days (96 hours), there were 43 hits, 29 false detections and 33 misses. 51 available position comparisons produce an average error of 157 nautical miles.
At the lead time of 5 days (120 hours), there were 33 hits, 32 false detections and 49 misses. 47 available position comparisons produce an average error of 220 nautical miles.
At the lead time of 6 days (144 hours), there were 32 hits, 39 false detections and 55 misses. 43 available position comparisons produce an average error of 243 nautical miles.
At the lead time of 7 days (168 hours), there were 32 hits, 46 false detections and 54 misses. 45 available position comparisons produce an average error of 286 nautical miles.
At the lead time of 8 days (192 hours), there were 28 hits, 58 false detections and 65 misses. 43 available position comparisons produce an average error of 347 nautical miles.
At the lead time of 9 days (216 hours), there were 28 hits, 54 false detections and 67 misses. 42 available position comparisons produce an average error of 328 nautical miles.
At the lead time of 10 days (240 hours), there were 30 hits, 54 false detections and 68 misses. 42 available position comparisons produce an average error of 436 nautical miles.
At the lead time of 11 days (264 hours), there were 29 hits, 55 false detections and 70 misses. 40 available position comparisons produce an average error of 483 nautical miles.
At the lead time of 12 days (288 hours), there were 29 hits, 66 false detections and 73 misses. 39 available position comparisons produce an average error of 525 nautical miles.
At the lead time of 13 days (312 hours), there were 20 hits, 65 false detections and 82 misses. 29 available position comparisons produce an average error of 481 nautical miles.
At the lead time of 14 days (336 hours), there were 20 hits, 70 false detections and 90 misses. 31 available position comparisons produce an average error of 559 nautical miles.
At the lead time of 15 days (360 hours), there were 16 hits, 72 false detections and 94 misses. 25 available position comparisons produce an average error of 593 nautical miles.
At the lead time of 16 days (384 hours), there were 20 hits, 79 false detections and 90 misses. 29 available position comparisons produce an average error of 626 nautical miles.
At the lead time of 17 days (408 hours), there were 15 hits, 94 false detections and 90 misses. 29 available position comparisons produce an average error of 755 nautical miles.
At the lead time of 18 days (432 hours), there were 13 hits, 117 false detections and 72 misses. 28 available position comparisons produce an average error of 855 nautical miles.
At the lead time of 19 days (456 hours), there were 12 hits, 96 false detections and 96 misses. 25 available position comparisons produce an average error of 875 nautical miles.
At the lead time of 20 days (480 hours), there were 11 hits, 91 false detections and 93 misses. 22 available position comparisons produce an average error of 860 nautical miles.
The table below shows the number of cases, where a track with a certain peak intensity ended up actually peaking with a certain intensity.

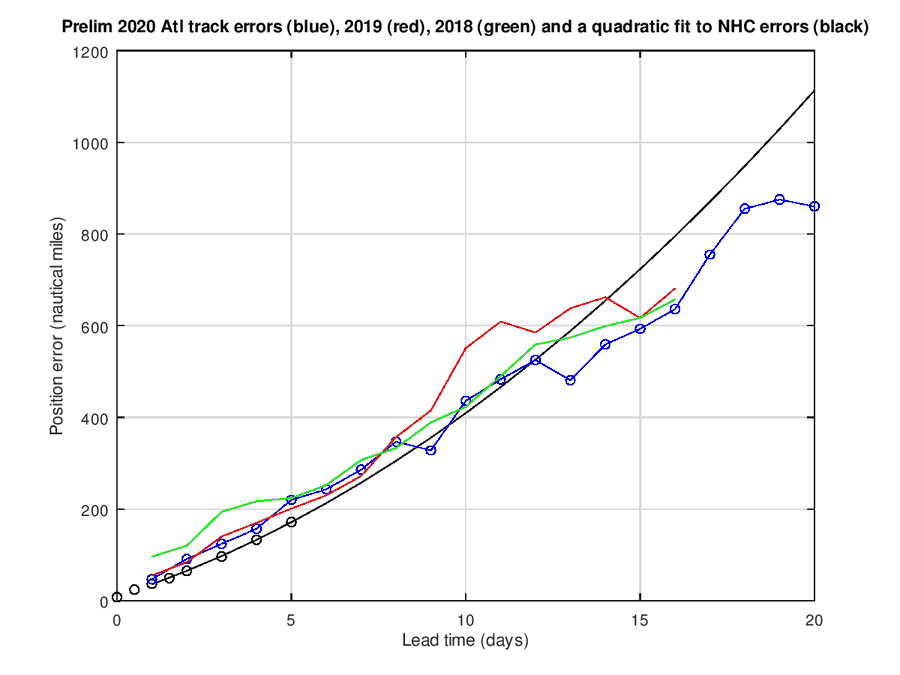
The graph below shows my average Atlantic track errors of latest three years, as well as a quadratic fit to 2015-2019 NHC errors.


Comments
Post a Comment