Total verification of tracks done in 2020 in East Pacific
Above: Possibly the most DOOMy East Pacific track of 2020. Category 4 landfall in eastern Oaxaca didn't come even near reality however. In real life, this system was Cristina, and it missed land altogether.
These tracks, or lack of those, have been earlier discussed in separate blog entries system-wise or time-wise:
01E
Amanda
Boris
04E
Cristina
06E
Unnamed (07E)
Douglas
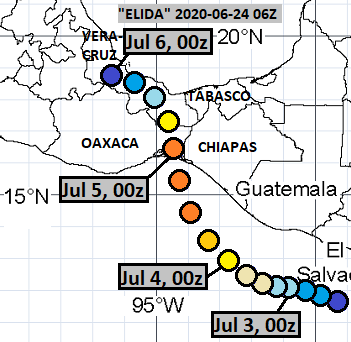
Elida
10E
Fausto
Genevieve
Hernan
Iselle
Julio
Karina
Lowell
Marie
Norbert
Odalys
Polo
ghost storms Jan-May
ghost storms Jun-Jul
ghost storms Aug-Oct
ghost storms Nov-Dec
In 2020, I analysed 557 model cycles.
I made 220 tracks of storms, that actually formed later.
I made 266 tracks of ghost storms.
I missed 148 times cyclogenesis, which actually happened within 480 hours.
At the lead time of 1 day (24 hours), there were 39 hits, 15 false detections and 6 misses. 51 available position comparisons produce an average error of 45 nautical miles.
At the lead time of 2 days (48 hours), there were 33 hits, 34 false detections and 9 misses. 47 available position comparisons produce an average error of 98 nautical miles.
At the lead time of 3 days (72 hours), there were 28 hits, 35 false detections and 16 misses. 42 available position comparisons produce an average error of 142 nautical miles.
At the lead time of 4 days (96 hours), there were 28 hits, 46 false detections and 16 misses. 45 available position comparisons produce an average error of 191 nautical miles.
At the lead time of 5 days (120 hours), there were 28 hits, 42 false detections and 15 misses. 41 available position comparisons produce an average error of 244 nautical miles.
At the lead time of 6 days (144 hours), there were 30 hits, 52 false detections and 16 misses. 46 available position comparisons produce an average error of 272 nautical miles.
At the lead time of 7 days (168 hours), there were 23 hits, 53 false detections and 20 misses. 38 available position comparisons produce an average error of 306 nautical miles.
At the lead time of 8 days (192 hours), there were 21 hits, 64 false detections and 31 misses. 36 available position comparisons produce an average error of 324 nautical miles.
At the lead time of 9 days (216 hours), there were 18 hits, 70 false detections and 35 misses. 35 available position comparisons produce an average error of 336 nautical miles.
At the lead time of 10 days (240 hours), there were 20 hits, 71 false detections and 33 misses. 35 available position comparisons produce an average error of 372 nautical miles.
At the lead time of 11 days (264 hours), there were 20 hits, 96 false detections and 25 misses. 37 available position comparisons produce an average error of 404 nautical miles.
At the lead time of 12 days (288 hours), there were 22 hits, 106 false detections and 25 misses. 33 available position comparisons produce an average error of 426 nautical miles.
At the lead time of 13 days (312 hours), there were 20 hits, 111 false detections and 25 misses. 32 available position comparisons produce an average error of 475 nautical miles.
At the lead time of 14 days (336 hours), there were 14 hits, 125 false detections and 32 misses. 29 available position comparisons produce an average error of 473 nautical miles.
At the lead time of 15 days (360 hours), there were 15 hits, 131 false detections and 36 misses. 28 available position comparisons produce an average error of 436 nautical miles.
At the lead time of 16 days (384 hours), there were 6 hits, 141 false detections and 42 misses. 20 available position comparisons produce an average error of 514 nautical miles.
At the lead time of 17 days (408 hours), there were 15 hits, 171 false detections and 34 misses. 33 available position comparisons produce an average error of 547 nautical miles.
At the lead time of 18 days (432 hours), there were 17 hits, 163 false detections and 37 misses. 39 available position comparisons produce an average error of 571 nautical miles.
At the lead time of 19 days (456 hours), there were 14 hits, 137 false detections and 35 misses. 34 available position comparisons produce an average error of 651 nautical miles.
At the lead time of 20 days (480 hours), there were 10 hits, 99 false detections and 43 misses. 31 available position comparisons produce an average error of 643 nautical miles.
The table below shows the number of cases, where a track with a certain
peak intensity ended up actually peaking with a certain intensity.

The graph below shows my average East Pacific track errors of latest two years, as well as a quadratic fit to 2015-2019 NHC errors.

The graph below shows a 30-day average of hits (in black), false detections (in red) and misses (in blue), calculated from analysed model cycles and interpolated values for the model cycles, that were skipped.


Comments
Post a Comment